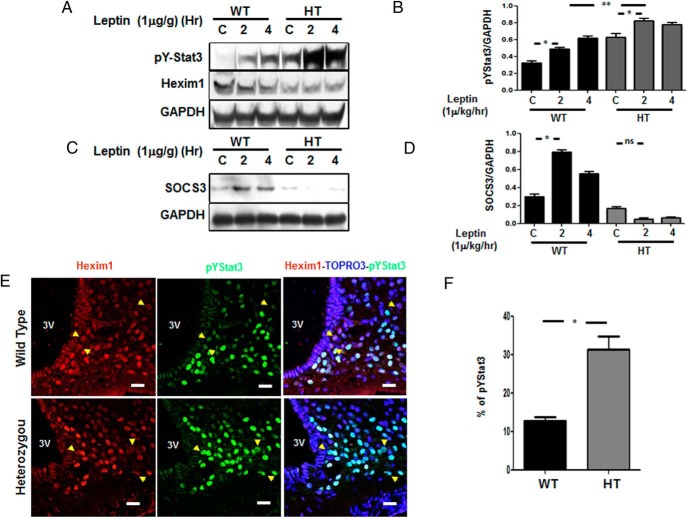
Figure 5.
Enhanced leptin signaling in the arcuate nucleus of HT mice. A, pYStat3 expression in the hypothalamus from WT or HT mice (upper panel), Hexim1 expression (middle panel), and GAPDH expression used as a loading control. B, Graphs showing data quantification of pY705Stat3 phosphorylation to GAPDH ratio after leptin treatment showing increased expression of pY705Stat3 in WT and HT mice at basal level and after 2 of leptin treatment. Data represent the mean ± SEM; *, P < .05. We also observed a significant increase in pY705Stat3 phosphorylation to GAPDH ratio in HT mice as compared with WT at 2 and 4 hours. Data represent the mean ± SEM; **, P < .001. C, SOCS3 expression, and GAPDH used as a loading control. D, Graphs showing data quantification of SOCS3 to GAPDH ratio in WT vs HT after leptin treatment showing decreased expression of SOCS3 in HT mice after 2 and 4 hours of leptin treatment. Data represent the mean ± SEM; *, P < .05. E, Confocal microscopy from hypothalamic sections from WT and HT mice after administering leptin 1 μg/g of body weight via ip for 4 hours showing the expression of Hexim1 (red), identified with antimouse 594, and pY705Stat3 (green), detected using antirabbit 488, in the arcuate nucleus. Yellow arrows indicate a lack of nuclear colocalization between Hexim1 and pY705Stat3 expression. A third panel shows overlapping Hexim1/TOPRO3 (nuclei)/pY705Stat3 signal; white bar, 40 μm. Quantitation of pYStat3 expression was obtained between WT and HT by determining the percentage of expression of pYStat3 vs 250 nuclei stained (TOPRO3) in 3 independent experiments. F, pY705Stat3 expression was significantly enhanced in the hypothalamus of HT mice after 4 hours of leptin treatment. Mean ± SEM; WT vs HT; *, P < .0001 paired t test. Mice were administered leptin 1 μg/g of body weight, given via ip for 2 and 4 hours.

