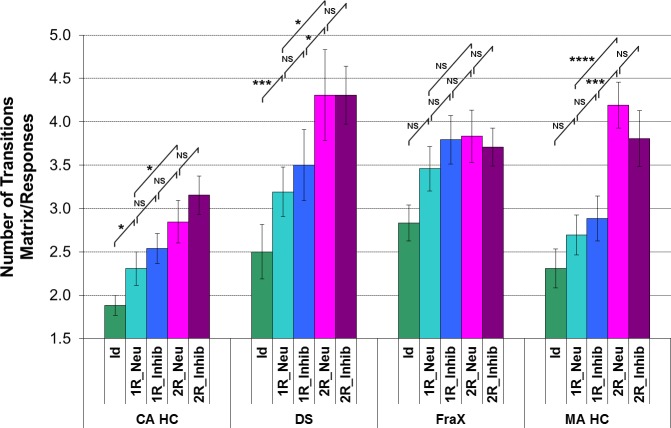
Fig 10. Analysis of the number of transitions between the matrix and the responses for the DS, FraX, and for both CA HC and MA HC.
(For display purposes and because the different chronological age-matched and mental age-matched control groups did not respectively differ significantly one from the other, the results of only one chronological age-matched control group and one mental age-matched control group are displayed).

