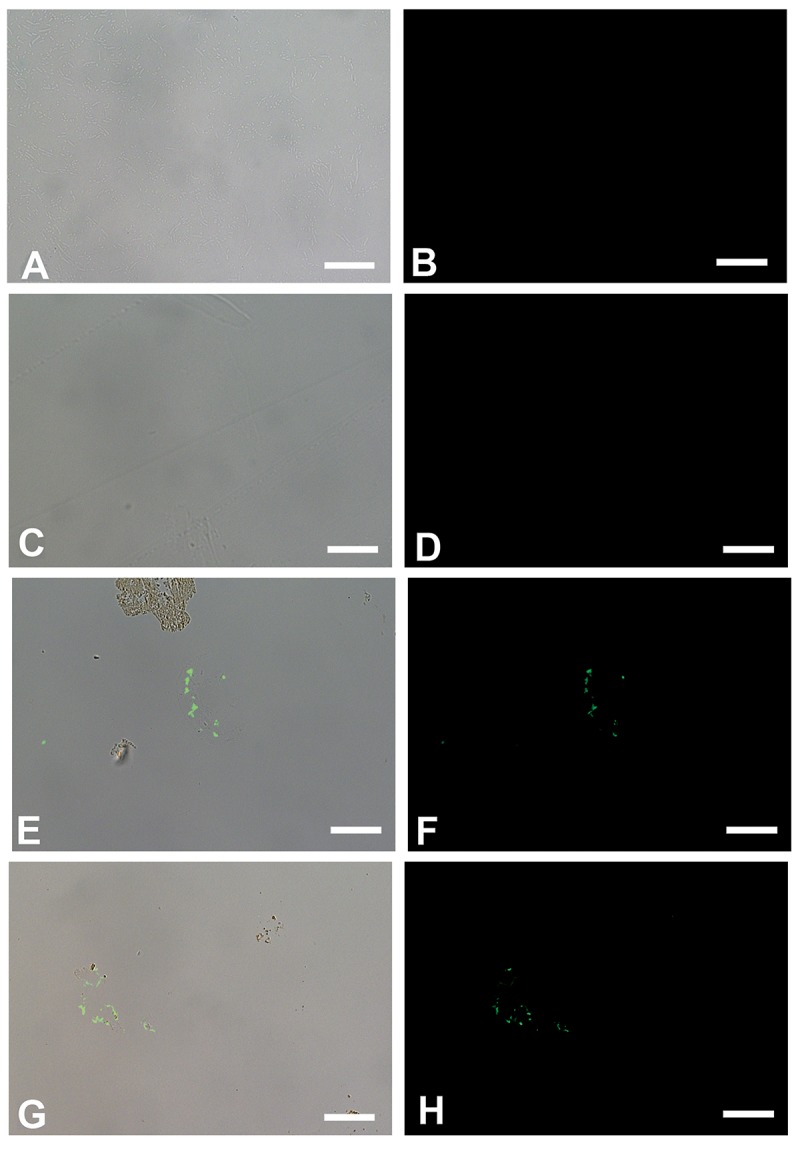
Fig 6.

In situ immunohistochemistry of biofilms (A-D) and dinosaur vessels (E-H) exposed to polyclonal antibodies raised against actin, a cytoskeletal protein (see methods for details). A, C, E, G are overlay images, showing where on the tissue the antibodies bind; B, D, F, H are fluorescent images showing only antibody binding, as represented by the green fluorescence of the FITC label. A, B represent B.cereus biofilm grown in bone; C,D is S. epidermidis biofilm; E, F is vessels from B. canadensis (MOR 2598 [3]), G, H, vessels from T. rex (MOR 1125 [1]). Scale bar for all images = 20 μm
