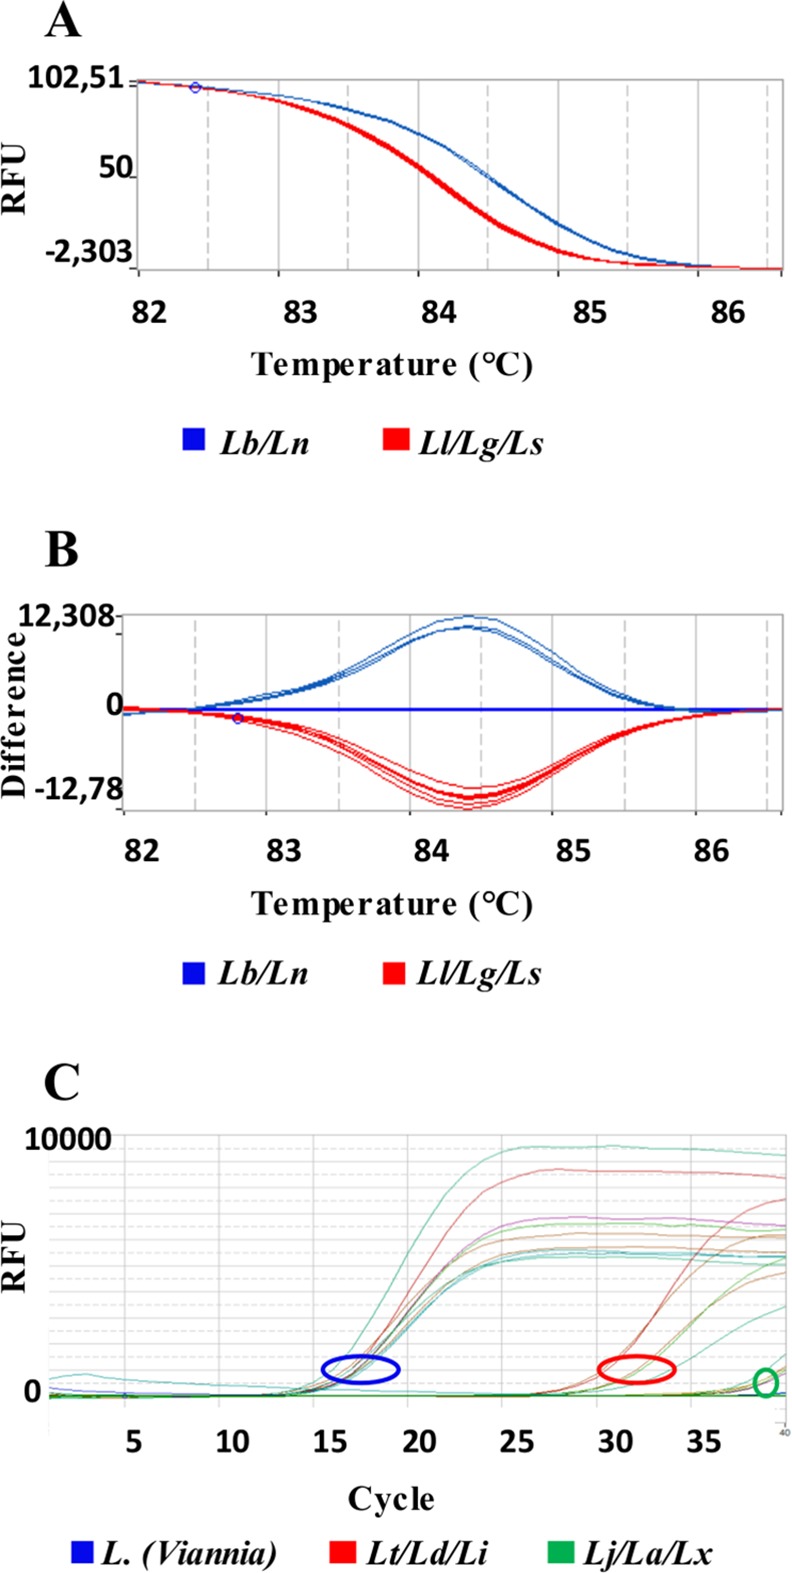
Fig 5. HRM plots of hsp70 amplicon 2.

Representative melting profiles of hsp70 amplicon 2. Panels (A) and (B) show the melting profiles of American L. (Viannia) species with data organized in normalized melting curves and normalized difference curves, respectively. (Lb): L. (V.) braziliensis; (Ln): L. (V.) naiffi; (Ll): L. (V.) lainsoni; (Lg): L. (V.) guyanensis and (Ls): L. (V.) shawi. Panel (C) shows the amplification curves in relation to the Ct, using DNA of the same species as A and B plus (Lt.): L. (L.) tropica; (Ld): L. (L.) donovani; (Li): L. (L.) infantum; (La): L. (L.) amazonensis; (Lx): L. (L.) mexicana and (Lj): L. (L.) major. Each sample was tested in duplicate.
