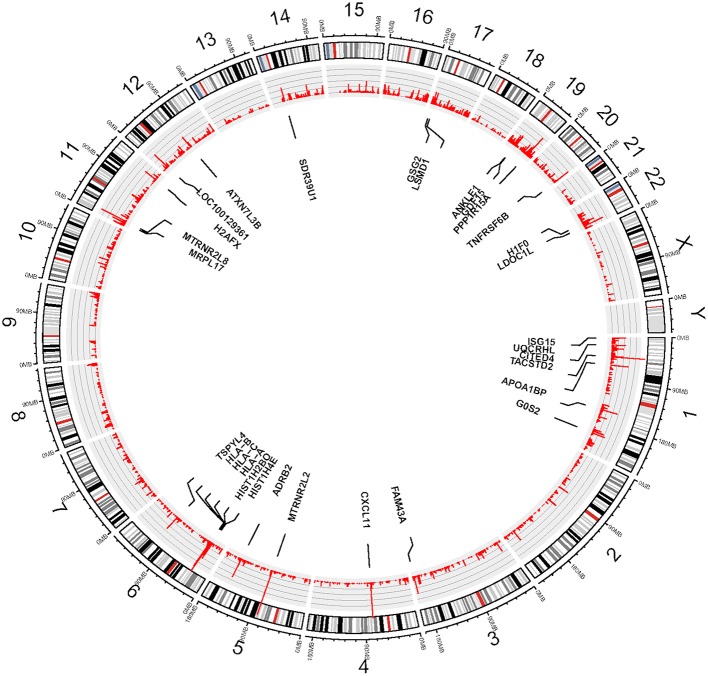
Figure 1.
Circos plot—View of expressed SNVs identified in hCMEC/D3 cell line by chromosomes. The frequency of the bar indicates the number of times the eSNVs were observed in a sample. The longer the red bar in the inner circle the more frequent the variant was observed in 8 BBB replicates. There are 30 genes identified after normalizing by gene length and numbers of mutations, the gene names are shown in the diagram.

