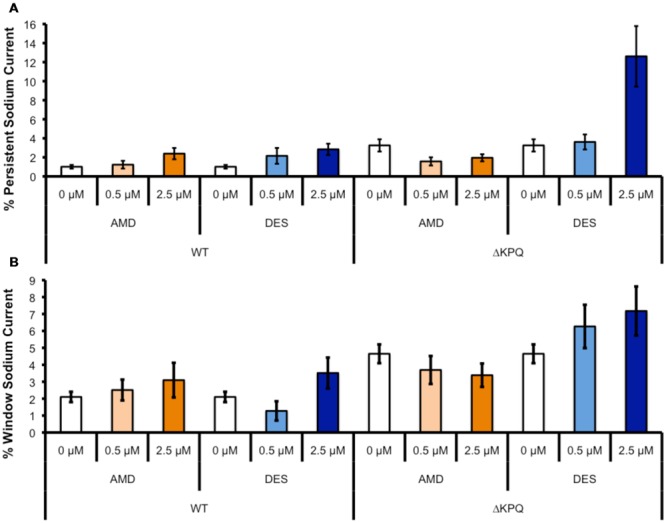
FIGURE 6.

(A) Shows the percentage of persistent sodium currents in either WT Nav1.5 or ΔKPQ channels after the perfusion of 0, 0.5, or 2.5 μM AMD (light or dark orange) or DES (light or dark blue). (B) Shows the percentage of window sodium currents in either WT Nav1.5 or ΔKPQ channels after the perfusion of 0, 0.5, or 2.5 μM AMD (light or dark orange) or DES (light or dark blue).
