
FIGURE 7.
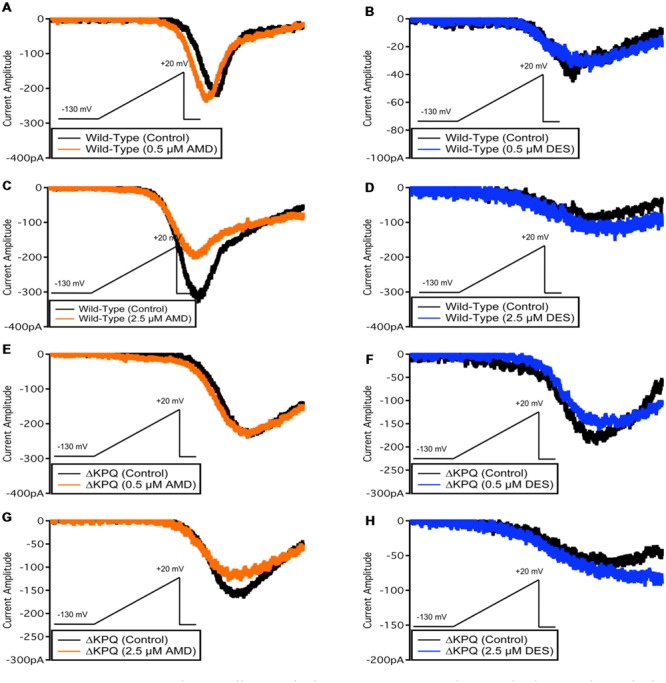
Representative sodium window currents. (A–H) Each panel shows the window currents in NaV1.5 or ΔKPQ before and after the perfusion of either 0.5 or 2.5 μM AMD or DES. Black curves represent control (0 μM drug solution), orange curves represent AMD at either 0.5 or 2.5 μM, and blue curves represent DES at either 0.5 or 2.5 μM.