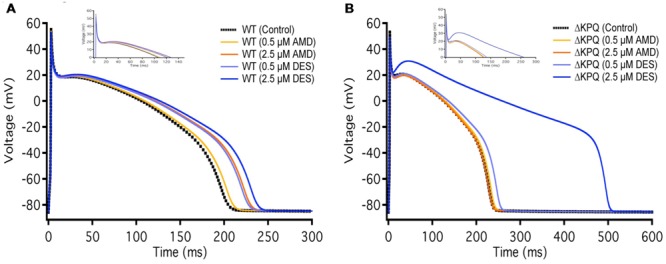
FIGURE 8.

Action potential model simulation. (A) Shows the simulations belonging to WT Nav1.5, where the black curve represents control, light and dark orange curves represent AMD perfusion at 0.5 and 2.5 μM, respectively, and light and dark blue curves represent DES perfusion at 0.5 and 2.5 μM, respectively. (B) Shows the simulations belonging to ΔKPQ, where the black curve represents control, light and dark orange curves represent AMD perfusion at 0.5 and 2.5 μM, respectively, and light and dark blue curves represent DES perfusion at 0.5 and 2.5 μM, respectively.
