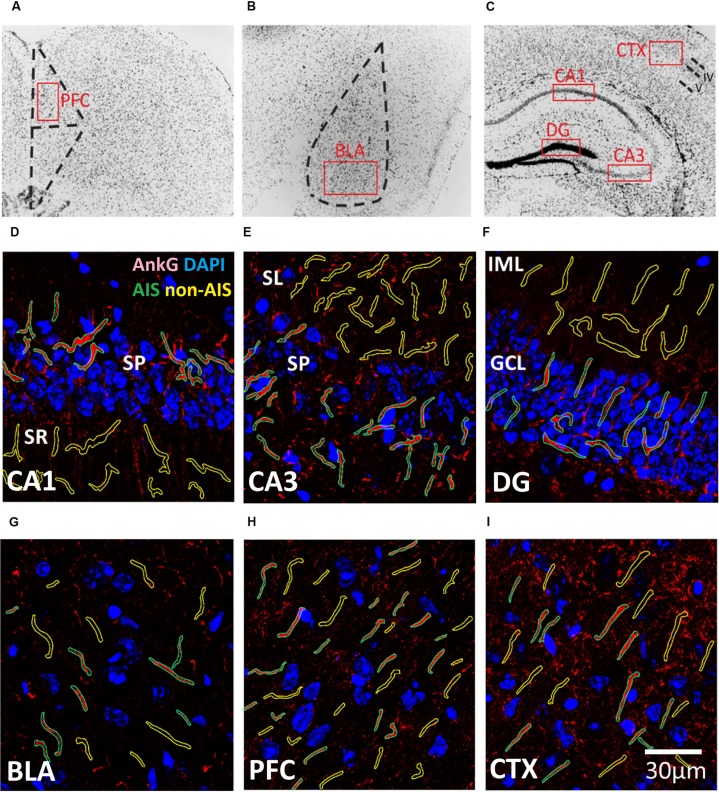
FIGURE 1.
(A–C) Representative illustration of the brain areas where immunofluorescent images were acquired from the (A) prefrontal cortex (PFC), (B) basal lateral amygdala (BLA), and (C) CXT/hippocampal regions (CA1, CA3, and DG). Areas were first located under 10× objective lens based on the contours of DAPI staining, and high magnification images were subsequently acquired using a 63× objective lens within the boundaries of each brain area (red boxes). (D–I) Examples of AIS (green) and Non-AIS (yellow) ROI contours delineated based on the AnkG (red) and DAPI (blue) confocal images of the (D) CA1, (E) CA3, (F) DG, (G) BLA, (H) PFC, and (I) CTX. Abbreviations: DG, dentate gyrus; BLA, basal lateral amygdala; PFC, prefrontal cortex; CXT, somatosensory barrel cortex; SP, stratum pyramidale; SR, stratum radiatum; SL, stratum lucidum; IML, inner molecular layer; GCL, granule cell layer.

