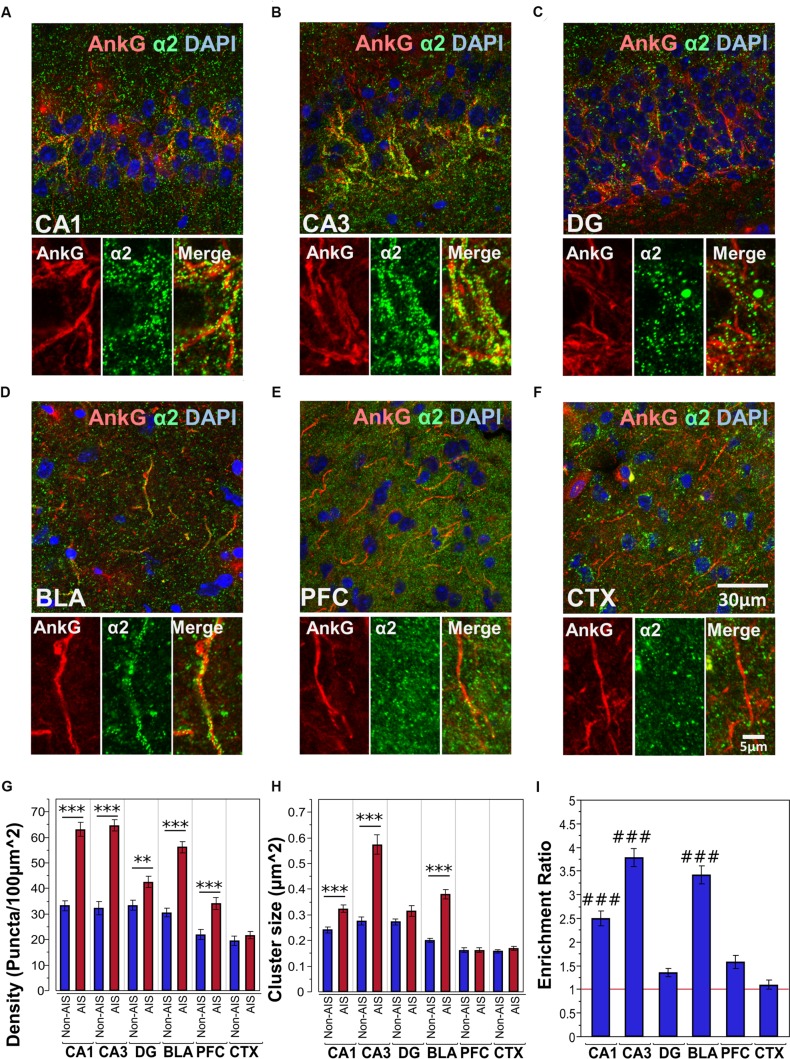
FIGURE 3.
(A–F) Immunofluorescent double-labeled montage images of AnkG (red) and α2-subunits (green) taken from single optical sections of the hippocampal sub-regions (CA1, CA3, DG), BLA, PFC, and CTX in C57BL/6J mice. (G,H) Average cluster density and size of α2-subunits on the AIS and non-AIS locations were reported as means ± SEM. Significant differences of cluster density were identified in the CA1, CA3, DG, BLA, and PFC. Significant differences of cluster size were identified in the CA1, CA3, and BLA. Asterisks represent significant difference from the AIS and the non-AIS locations using the Bonferroni method for planned multiple comparison, ∗∗p < 0.01, ∗∗∗p < 0.001. (I) Enrichment ratios of α2-subunits across different brain areas were reported. Tukey-Kramer post hoc pair-wise multiple comparison revealed the enrichment ratios of α2-subunits in the CA1, CA3, and BLA were significantly higher than the other brain areas, ###p < 0.001.

