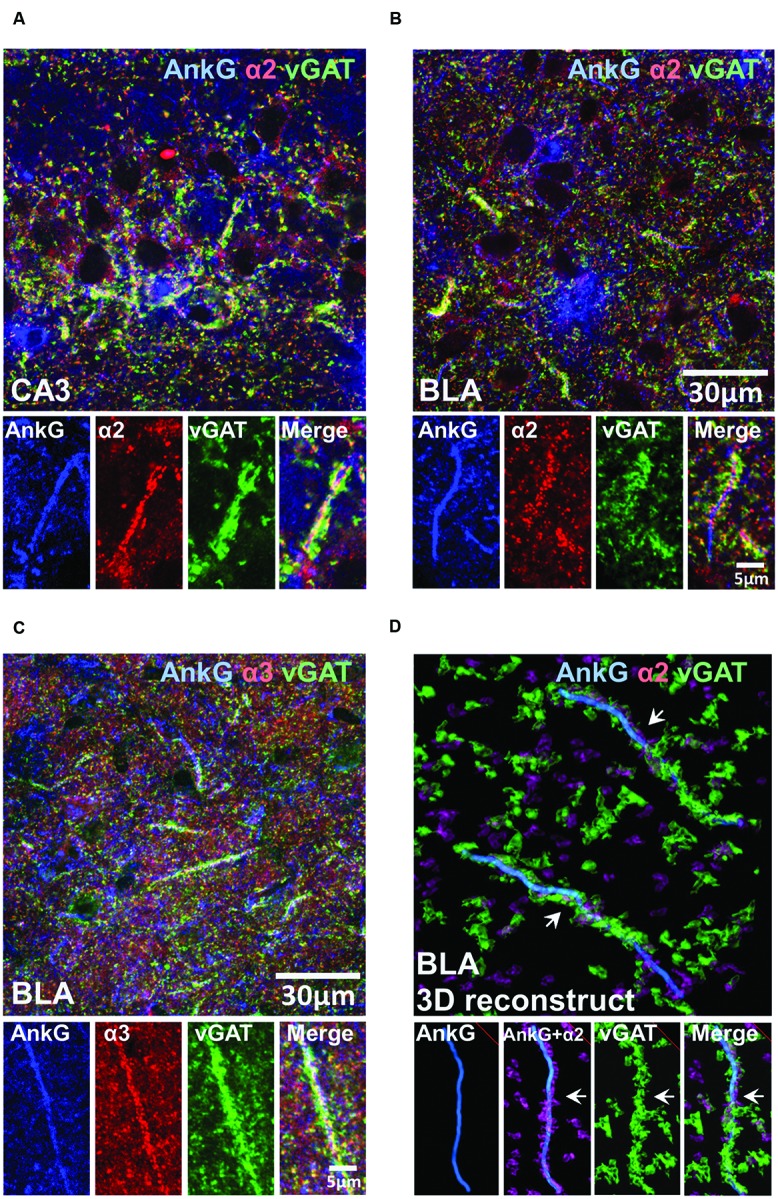
FIGURE 6.

(A–C) Immunofluorescent triple-labeled montage images of AnkG (blue), α2/3-subunits (red), and vGAT (green) taken from single optical sections of the CA3 and BLA in C57BL/6J mice. Prominent triple-colocalizations in all images were evident. (D) 3D-reconstructed contours of AnkG, α2-subunit, and vGAT from z-stack image series taken in the BLA. The arrows indicated the turning points where the vGAT-positive terminals wrap around the AnkG-positive AIS.
