FIGURE 7.
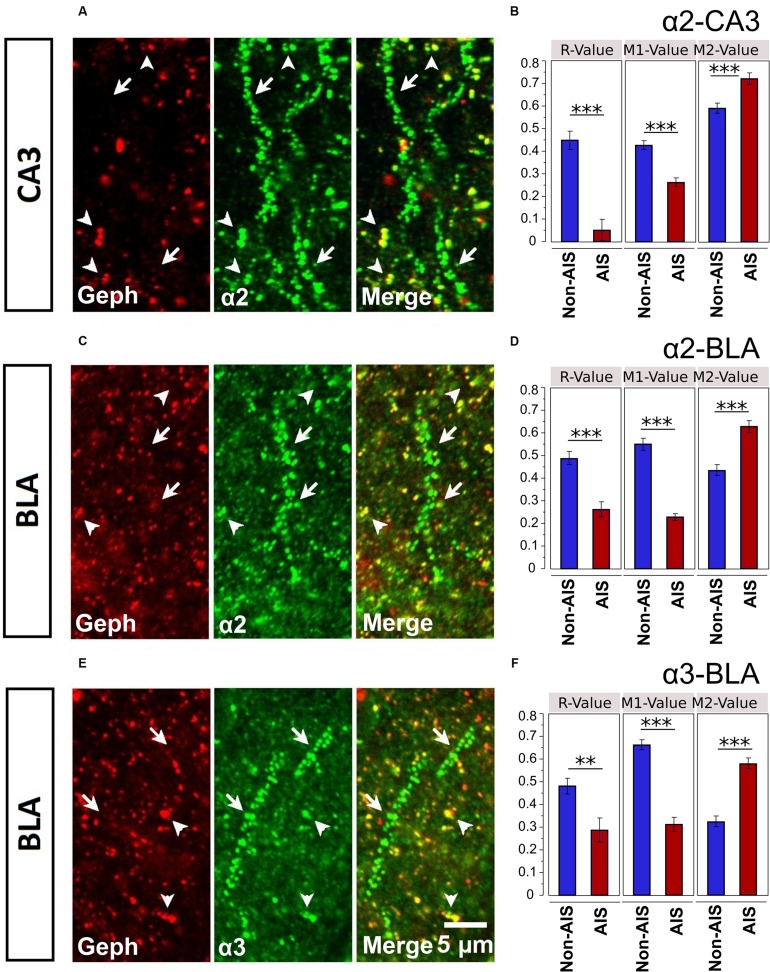
(A,C,E) Immunofluorescent double-labeled montage images of Geph (red), and α2/3-subunits (green) taken from single optical sections of the CA3 and BLA in C57BL/6J mice. Arrows with tails were pointed to the AIS regions, whereas the arrows without tails were pointed to the non-AIS regions. (B,D,F) Quantification results (Pearson’s R-value, and Manders’ M1 and M2 values) of the colocalizations of the α2- and α3-subunits with Geph on the AIS-like and non-AIS-like locations were reported as means ± SEM. Bonferroni-corrected planned multiple t-test comparisons revealed both the R-values and the M1-values (denoting the degree of α-subunit immunoreactivity that is overlapped with Geph immunoreactivity) were significantly lower in AIS-like locations when compared to non-AIS-like locations, whereas the M2-values (denoting the degree of Geph immunoreactivity that is overlapped with α-subunit immunoreactivity) were significantly higher in AIS-like locations when compared to non-AIS-like locations, ∗∗p < 0.01, ∗∗∗p < 0.001.

