
Figure 6. Early indicators of apoptosis .
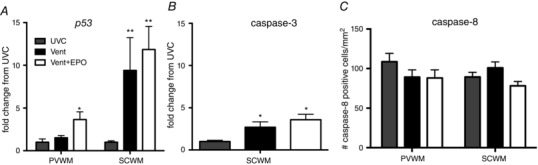
A, p53 gene expression was increased in Vent+EPO compared to UVC and Vent groups in the periventricular WM (PVWM) and in Vent and Vent+EPO groups compared to UVC in the subcortical WM (SCWM). B, caspase‐3 gene expression was increased in Vent and Vent+EPO compared to UVC in the SCWM. C, there was no difference in density of caspase‐8 positive cells in the PVWM or SCWM between groups. *P < 0.05 and **P < 0.001 compared to UVC.