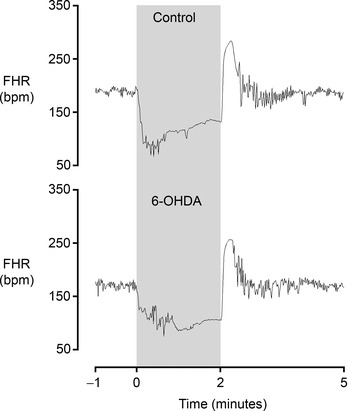
Figure 6. Examples of fetal heart rate patterns from the middle phase in the control and 6‐OHDA groups .

Note that fetal heart rate variability during the inter‐occlusion period is no different between groups. The shaded region denotes the period of asphyxia. Data are 1 s averages.
