
Figure 1. Volcano plot illustrating the relationship of gene expression in fetal kidney cortex measured by log2 of fold‐change .
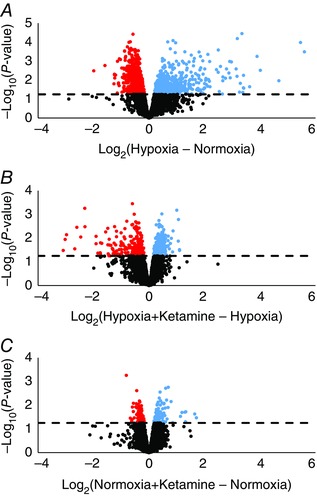
Significantly upregulated (blue) and downregulated (red) genes under hypoxia (A), hypoxia + ketamine (B), and normoxia + ketamine (C). The dashed line indicates whether the gene is statistically significant (above), P ≤ 0.05, or not significant (below). Non‐significant genes are indicated by black circles, and the scale for the y‐axis varies between plots.