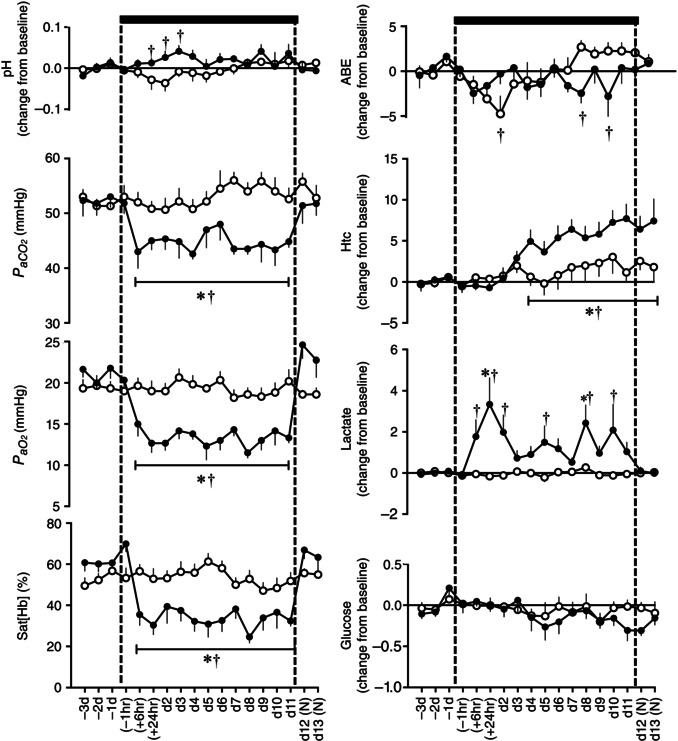
Figure 3. Fetal blood gas, acid base and metabolic status .

Values are mean ± SEM for fetal sheep undergoing normoxic (◯, n = 6) or chronic hypoxic ( , n = 6) pregnancy. Fetal blood gas values were corrected to 39.5 °C. pH, arterial pH; , arterial CO2 partial pressure; , arterial O2 partial pressure; Sat[Hb], percentage saturation of haemoglobin; ABE, acid base excess; Htc, haematocrit; Glucose, blood glucose concentration; Lactate, blood lactate concentration; (N), normoxic recovery. The x‐axis shows time in hours (hr) and days (d). Significant differences (P < 0.05): *differences indicating a significant main effect of time compared with baseline; †differences indicating a significant main effect of treatment compared with normoxic pregnancy (two‐way repeated‐measures ANOVA + Tukey test).
