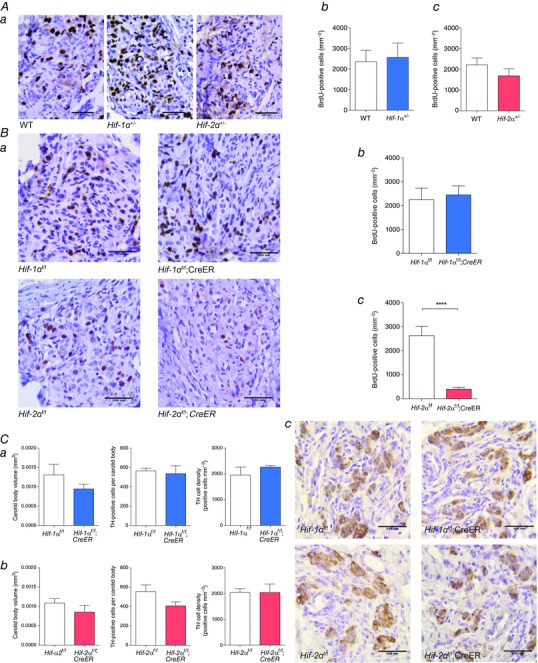
Figure 5. Hypoxia‐induced cellular proliferation and CB morphology in mice with conditional or constitutive inactivation of Hif‐1α or Hif‐2α .

Immunostaining for BrdU performed on CB sections from: A, Hif‐1α+/− or Hif‐2α+/− compared to wild‐type (WT) littermates; and B, tamoxifen‐treated Hif‐1αf/f;CreER or Hif‐2αf/f;CreER compared to Hif‐1αf/f or Hif‐2αf/f littermate controls. All mice were treated with BrdU and exposed to 10% oxygen for 7 days prior to being killed and preparation of tissues. Representative images from each genotype are shown in Aa and Ba where BrdU‐positive cells are stained brown (scale bar = 0.04 mm). Ab–c and Bb–c, Quantification of BrdU‐positive cells in CBs of Hif‐1α+/− (Ab) or Hif‐2α+/− (Ac) compared to WT littermates and tamoxifen‐treated Hif‐1αf/f;CreER (Bb) or Hif‐2αf/f;CreER (Bc) compared to controls of similar genotype but lacking the CreER allele (n = 6 pairs per genotype). C, immunostaining for tyrosine hydroxylase (TH) performed on CB sections from Hif‐1αf/f;CreER or Hif‐2αf/f;CreER compared to Hif‐1αf/f or Hif‐2αf/f littermate mice, 8–9 weeks after tamoxifen treatment. Morphometric analysis of CB volume, TH‐positive cell number and TH‐positive cell density in CBs of Hif‐1αf/f;CreER (Ca) or Hif‐2αf/f;CreER (Cb) compared to controls lacking the CreER allele (n = 3 pairs per genotype). Cc, representative images from each genotype with TH‐positive cells stained brown (scale bar = 0.04 mm). Values shown are mean ± SEM; ****P < 0.0001.
