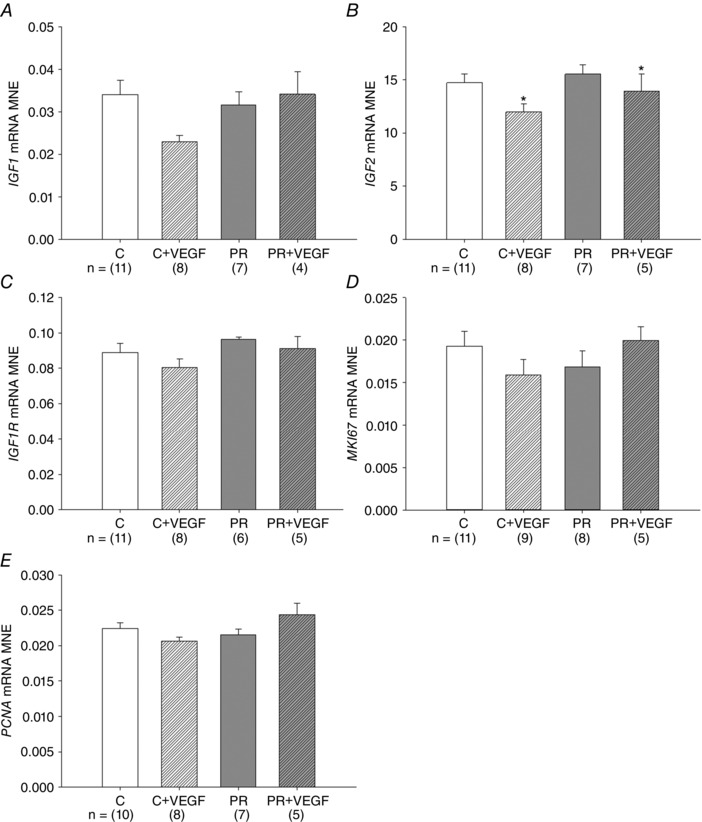
Figure 3. Effect of VEGF on markers of cellular proliferation .

MNE of genes regulating cellular proliferation [IGF1 (A), IGF2 (B), IGF1R (C), MK167 (D) and PCNA (E)] in the fetal lung. Control (C) (open bar); C + VEGF (open hashed bar); PR (grey bar); PR + VEGF (grey hashed bar). The sample size for each group is indicated below the individual graphs. Data (mean ± SEM) were analysed by two‐way ANOVA for treatment (Control vs. PR) and drug (Saline vs. VEGF). *P < 0.05 from C or PR (i.e. drug effect).
