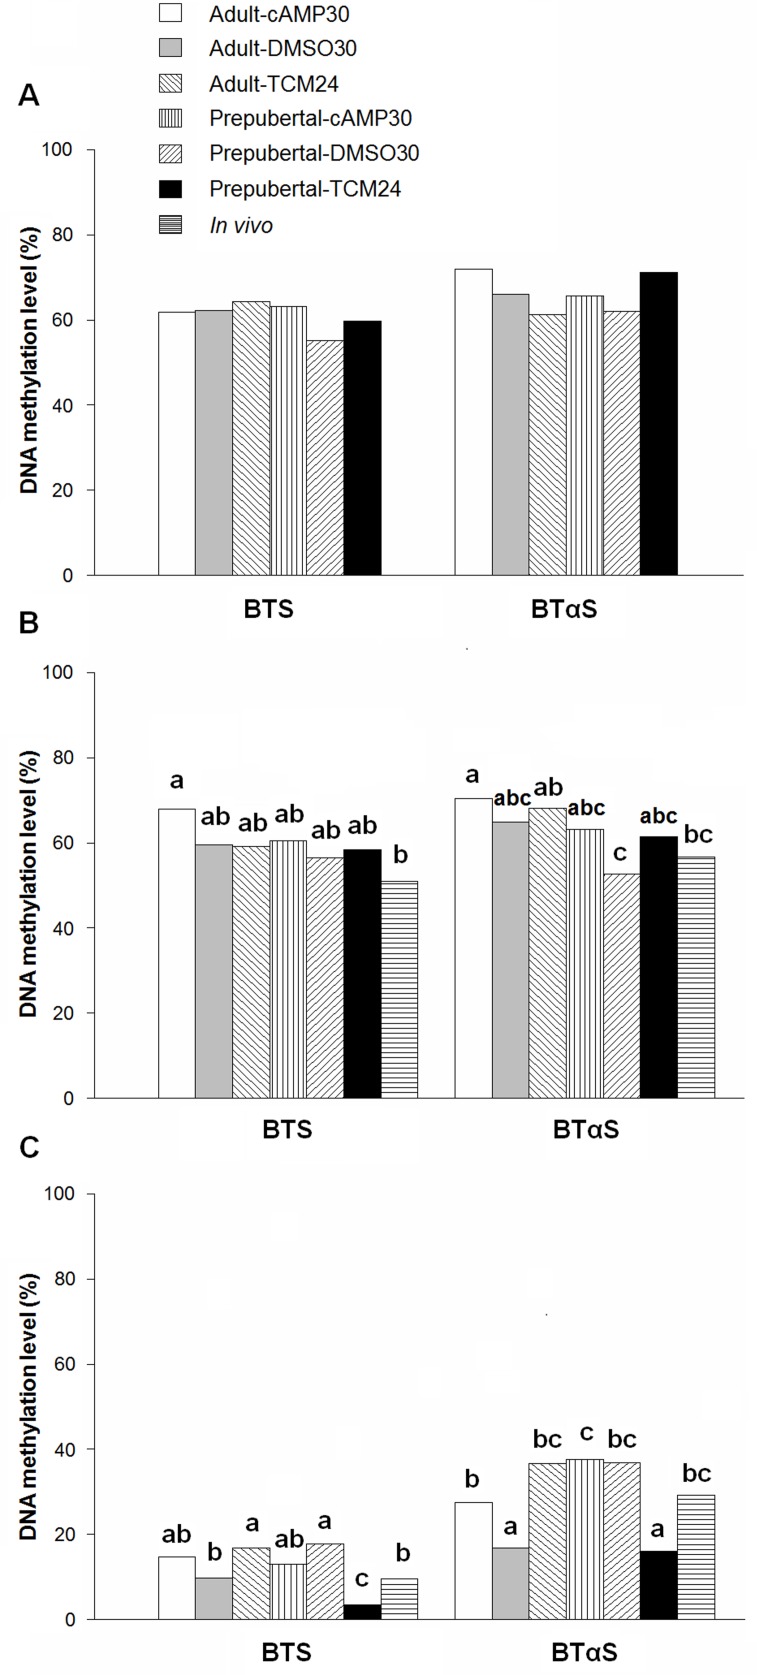
Fig 5. DNA satellite methylation profiles in immature oocytes, MII oocytes and expanded blastocysts derived from adult and prepubertal donors.
Oocytes were obtained via OPU and treated prior to and during IVM with cAMP modulators. A) Immature oocytes, B) Matured oocytes and C) Expanded blastocysts. The percentages were calculated using the total number of samples per treatment and statistical analyses were performed with the absolute values. Therefore, no averages or SEMs are presented. Bars represent the percentages of DNA methylation calculated using the total number of CpG analyzed in each treatment. Columns with different superscripts differ significantly for the respective satellite and developmental status (a, b, c). Data were analyzed by Chi-squared test followed by pairwise comparison of proportions method; immature and MII oocytes, n = 3; blastocysts, n = 5; P < 0.05. DNA methylation profiles were similar in immature oocytes from all treatments. Hypermethylation was observed for adult matured oocytes treated with cAMP modulators compared with in vivo matured oocytes. Lower DNA methylation levels were found for prepubertal oocytes after DMSO treatment compared to adult in vitro matured oocytes. Similar DNA methylation levels of both satellite sequences were observed for blastocysts produced from oocytes treated with cAMP modulators and in vivo produced blastocysts from both types of donors. DNA methylation levels were aberrant for blastocysts from TCM24 and DMSO30 treatments compared to in vivo counterparts. BTS, Bovine testis satellite I; BTαS, Bos taurus alpha satellite I.

