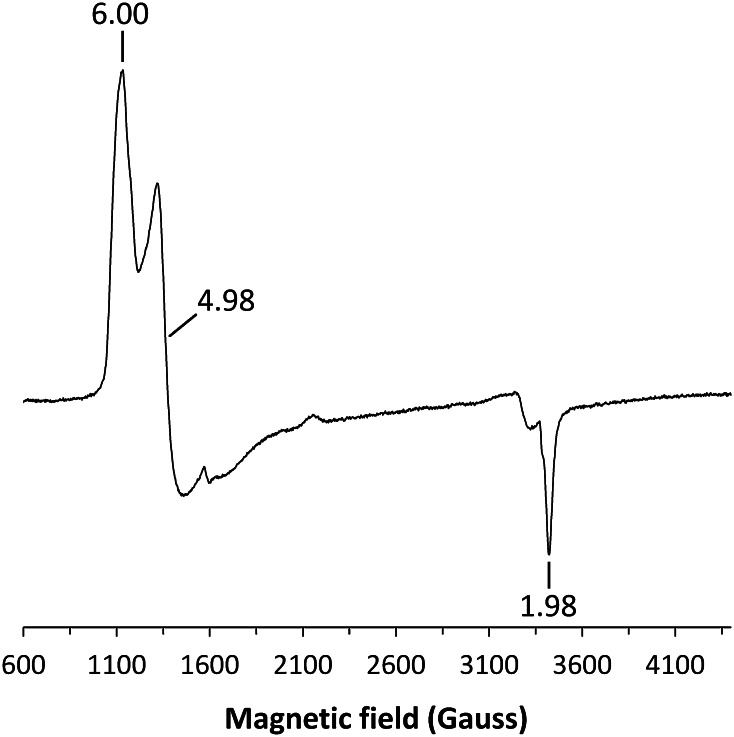
Fig. 2.
Low temperature EPR spectra of SK 5912 sorghum peroxidase (ca. 100 μM; the spectrum is given at a relative amplification of G = 0.50). The spectra were recorded at 10 K at the following instrumental conditions: microwave frequency ν MW = 9.467 GHz, microwave power P MW = 3.19 mW, modulation frequency ν m = 100 kHz, modulation amplitude A m = 5 G, time constant τ = 81.9 ms, scan rate V = 22.65 G/s. Conditions: pH = 6.0 (50 mM sodium phosphate)

