Figure 2.

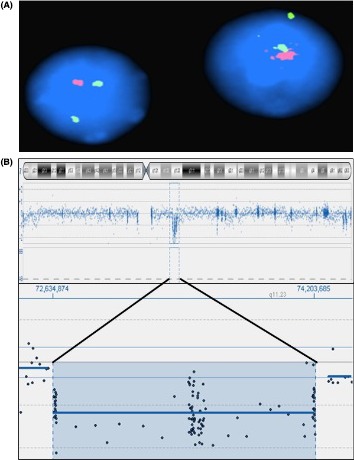
FISH and Array CGH ideograms. (A) Two interphase nuclei showing a single signal for the Elastin probe (red) and two signals for the control probe (green); (B) Chromosome icon and the zoom‐in on the deleted region.

FISH and Array CGH ideograms. (A) Two interphase nuclei showing a single signal for the Elastin probe (red) and two signals for the control probe (green); (B) Chromosome icon and the zoom‐in on the deleted region.