
Figure 4.
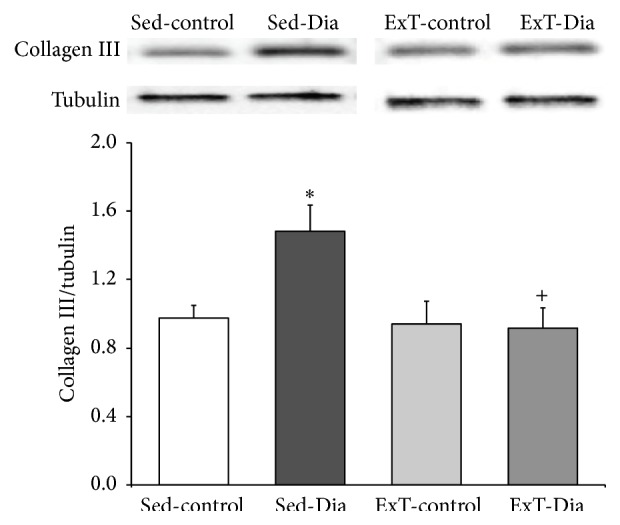
Collagen III expression in atria: top: representative Western blot showing collagen III protein expression in Sed-control, Sed-Dia, ExT-control, and ExT-Dia animals; bottom: densitometry analysis of collagen III expression normalized to β-tubulin as loading control. n = 6 in each group. Values represent mean ± S.E. ∗ P < 0.01 versus Sed-control group. + P < 0.05 versus Sed-Dia group.