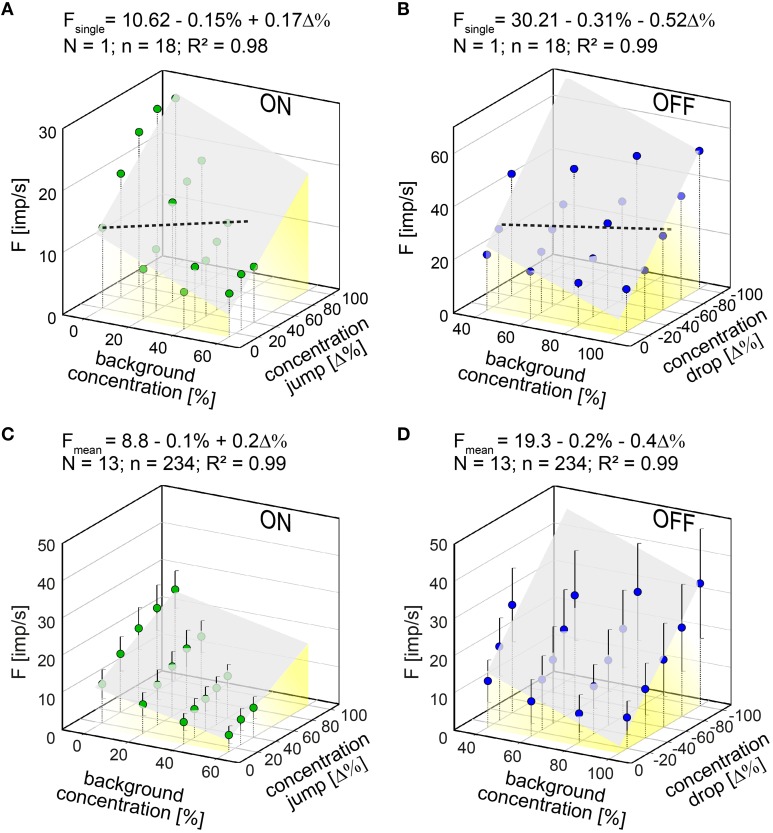
Figure 3.
(A,B) Responses of a single ON ORN (A) and a single OFF ORN (B) plotted as a function of background concentration and jumps or drops in odor concentration, respectively. Dotted horizontal lines: equal frequency line at 10 imp/s for the ON ORN and 30 imp/s for the OFF ORN. (C,D) Mean responses of 13 ON ORN (C) and 13 OFF ORN (D) plotted as a function of background concentration and jumps or drops in odor concentration, respectively. Error bars represent SEM. Multiple regressions which utilize 3-dimensional planes (F = y0 + aC + bΔC; where F is the impulse frequency, and y0 the height of the regression plane) were calculated to determine the gain for background concentration (a slope) and the concentration change (b slope) on the response. Note that the sign of the concentration axis in (A,C) is oriented in different direction than in (B,D). N number of ORNs, n number of points used to calculate regression plane (A,B) or mean responses (C,D), R2 coefficient of determination.

