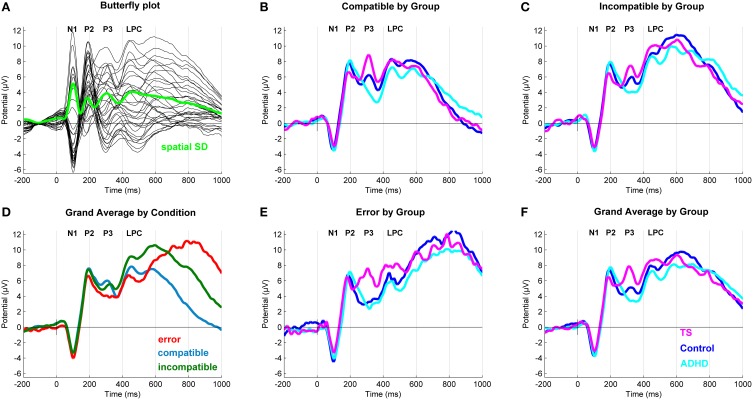
Figure 2.
Stimulus-locked event-related potentials (ERP). (A) Butterfly plot. Topographical distribution of the P3 component across outcomes. (D) Grand average ERP by Outcome at a central region of interest for compatible (blue), incompatible (green) and erroneous (red) trials. (B,C,E) Grand average ERPs at a central region of interest with a N1 (108 ms), P2 (196 ms), P3 (320 ms), and a Late Positive Component (598 ms) for compatible, incompatible and erroneous trials. (F) Grand average ERP by Group. Group differences for Tourette syndrome (TS) (pink), attention-deficit/hyperactivity disorder (ADHD) (turquoise) and control children (blue) at a central region of interest.

