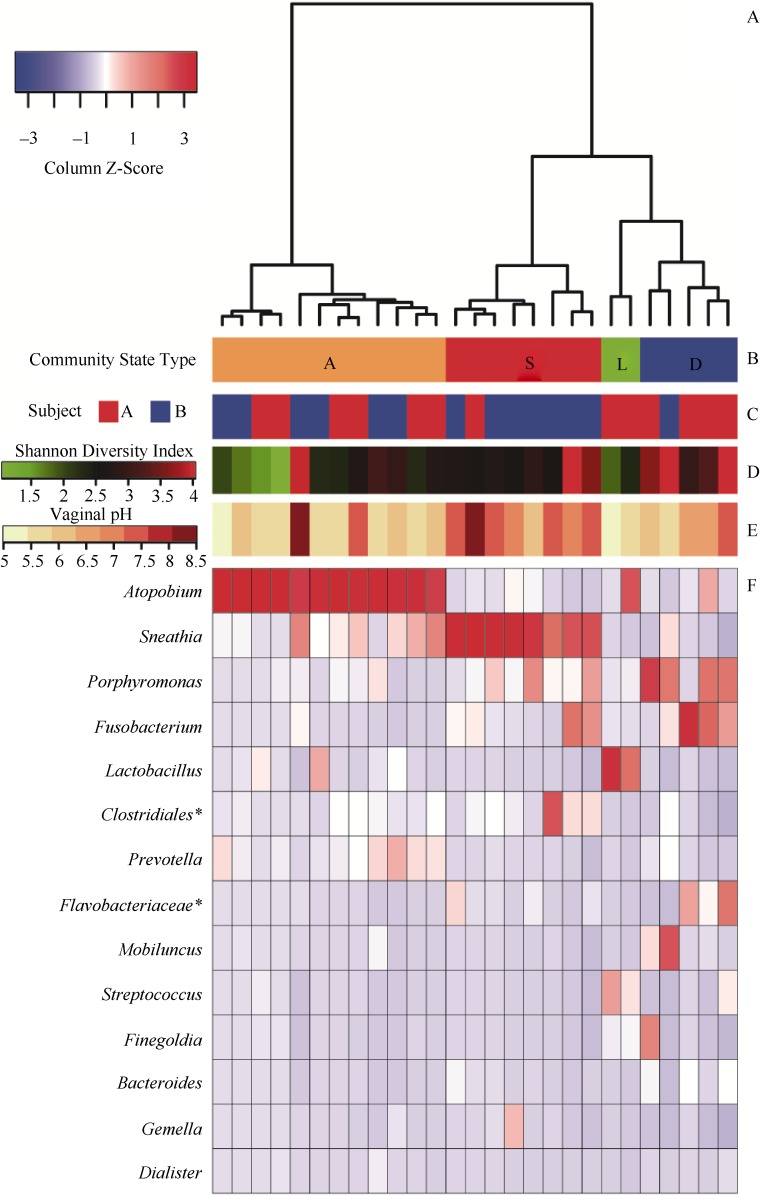
Figure 1.
Clustering analysis of vaginal bacterial communities
A: Ward linkage hierarchical cluster dendrogram of the Bray-Curtis distances between bacterial communities in 27 samples from two northern pig-tailed macaques (Macaca leonina). B: Color bar indicating vaginal bacterial CST wherein each sample was assigned to one of four CSTs (CST A, CST S, CST L, and CST D). C: Lower colored blocks indicate the subject from which the sample was obtained. D: Shannon diversity indices calculated for the 27 samples (color key is indicated in the middle left side). E: Vaginal pH measurements for the 27 samples (color key is indicated in the middle left side). F: Heatmap of the relative abundances of the 14 most abundant phylotypes (mean relative abundance of each phylotype across all samples of the two subjects was above 1%). Column Z-score indicates differences between samples in terms of relative abundances of phylotypes associated with the samples. Individual cells are color-coded according to Z-scores to show the normalized abundance of a phylotype in one sample relative to the mean abundance across all phylotypes of the column. Relative intensity of the colors indicates how many standard deviations the observed phylotype abundance is above or below the mean. White color indicates relative abundance of phylotypes with column average. Blue color indicates relative abundances less than average abundance. Red color indicates relative abundance above column average. Phylotypes are listed in order of dominance, with the most dominant on the top. *represents unclassified genera of order/family.

