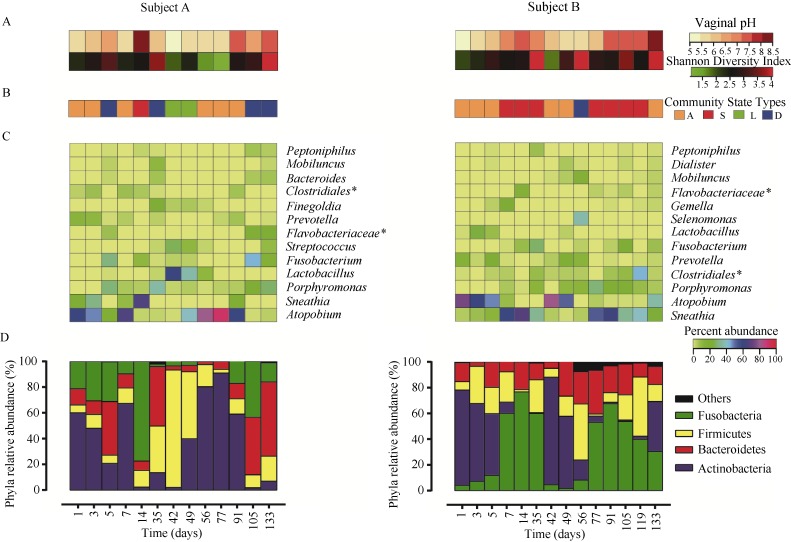
Figure 2.
Temporal dynamics of vaginal bacterial communities
A: Vaginal pH measurements and Shannon diversity indices calculated for each of the 13 samples of subject A and 14 samples of subject B (color key is indicated in the top right corner). B: Profiles of CST for the two northern pig-tailed macaques over time. Each cell represents one sample in the time series. The CSTs in the time series for each macaque are color-coded (lower colored blocks indicate CST wherein each sample was assigned to one of the four CSTs). C: For each macaque, a heatmap was constructed from the relative abundances of phylotypes that comprised at least 1% of the sequences found in that macaque (color key is indicated in the middle right side). Phylotypes are listed in order of dominance, with the most dominant on the bottom. *represents unclassified genera of order/family. D: For each macaque, the bar plot represents the relative abundances of phyla that comprised at least 1% of the total sequences found in that macaque. Phyla that comprised less than 1% of the total sequences found in that macaque were grouped into the “Others” category.

