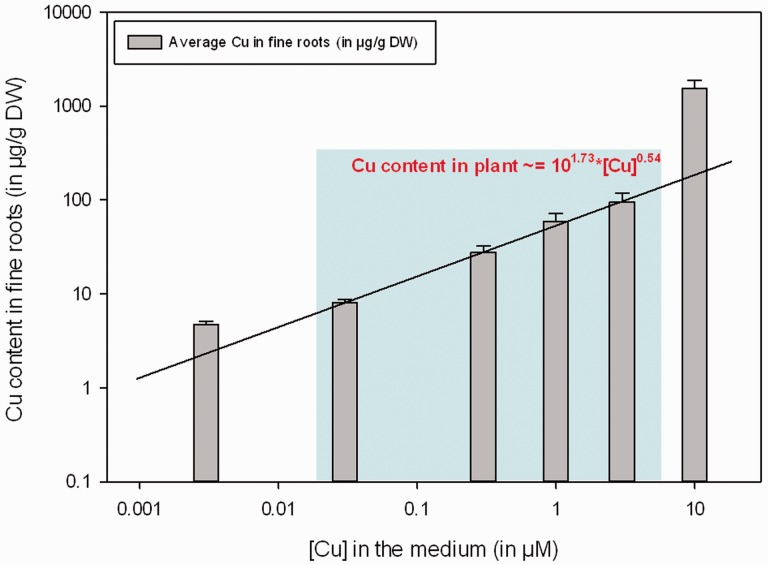
Fig. 4.
Copper content measured in the fine roots according to the concentration of copper in the medium. The blue frame refers to the range of copper concentration in which the content of copper can be modeled by the function: Copper in plant (in µg g–1 DW) = 101.73 × [Copper in the medium (in µM)]0.54.

