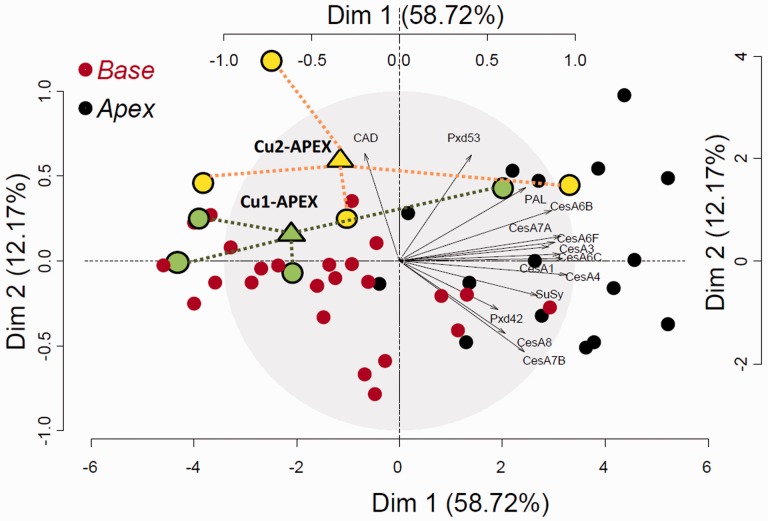
Fig. 5.
PCA of the gene expression data. Red dots refer to basal samples, and black dots refer to apical samples. Green and yellow circles represent the apical stem individuals from plants grown at Cu1 and Cu2, respectively. Triangles refer to the barycenter of the latter. The expression profile of 14 cell wall-related genes analyzed on 48 samples is represented.

