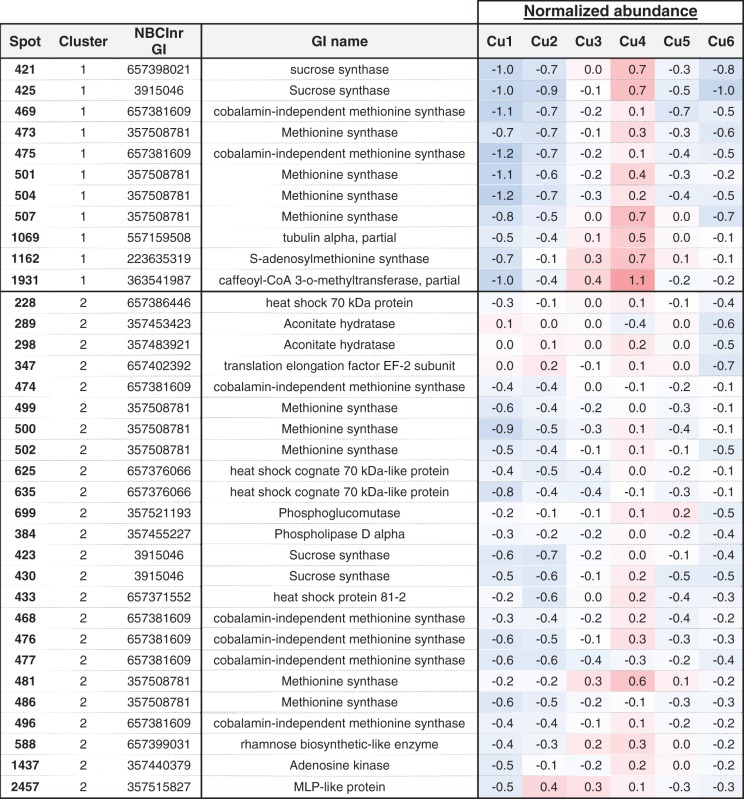
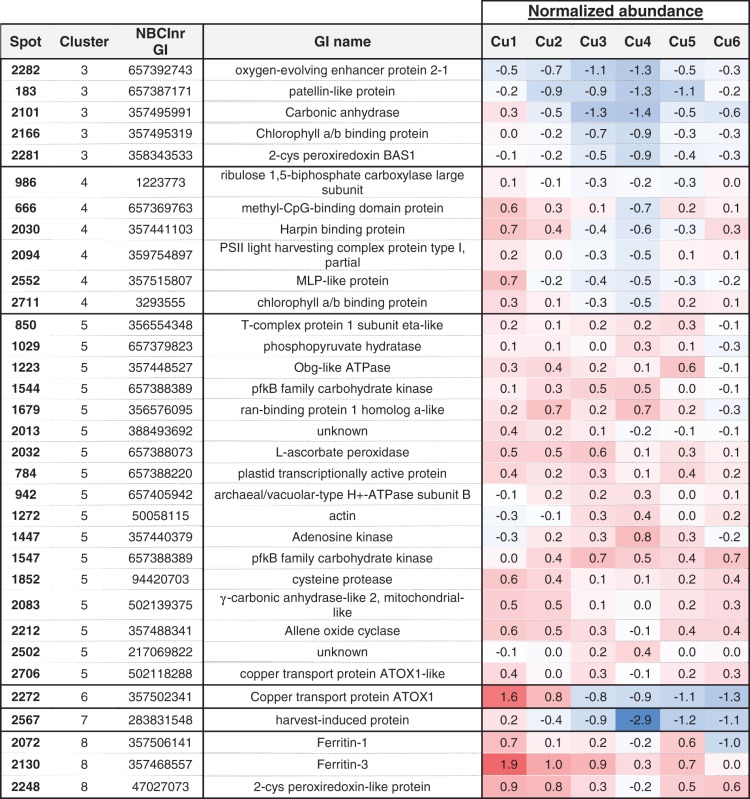
Table 3.
Clustering of the proteins that highly contribute to differentiate the plants grown under copper deficiency (Cu1) from those grown at optimal conditions (Cu4)
 |
 |
Represented are the proteins whose abundance varied significantly with the treatment (P-value ANOVA < 0.05, global data set) and that highly contribute to differentiate Cu1 from Cu4 after applying the ‘dimdesc’ function of the R package FactoMineR at the threshold of 0.05.
Normalized abundances are represented by a color gradient from blue (negative values) to red (positive values). Additional data are available in Supplementary Table S3.
