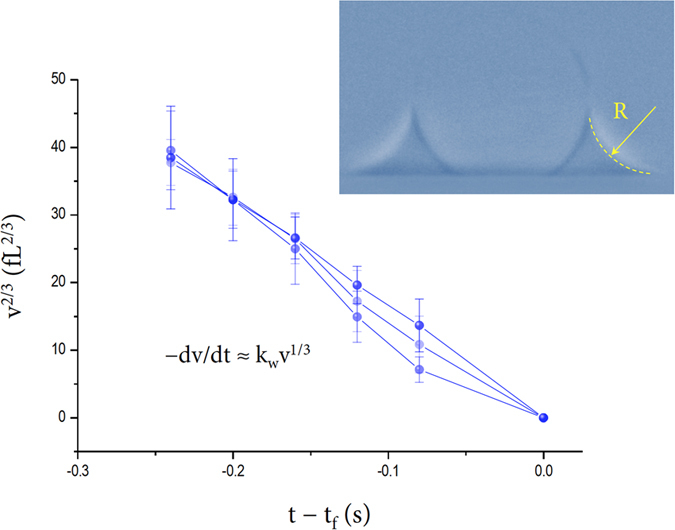
Figure 4. Evaporation rates at the final stages.

Evaporation dynamics of water capillary bridges whose volumes gradually decrease with time from characteristic volumes of v0 ~ 240 fL. The volume changes are described as v2/3 = v02/3 – (⅔) kwt and v → 0 as t → tf, where kw is a constant and is experimentally set as ~ 248 fL2/3/s for water. The evaporation rate expression of −dv/dt = kwv1/3 is similar to the sessile drop evaporation law20,24, but the evaporation rate for a bridge is slower than that for a hemisphere sessile drop with identical surface area. The error bars were determined by the repetition of measurements for each sample.
