
Figure 3.
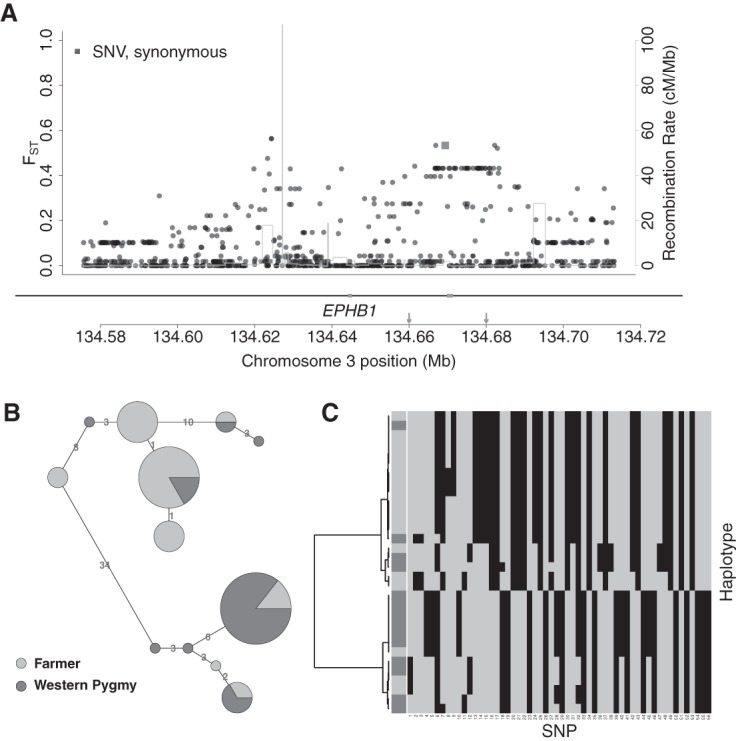
Candidate selection signal in EPHB1. (A) Distribution of FST, functional annotation (RefSeq and ENCODE elements) (Methods), and recombination rate (Hinch et al. 2011) for all variants (dots) in the candidate locus Chr 3: 134572433–134716365. Genes are shown under the plot with black lines (noncoding sequences) and gray boxes (exons). (B) Haplotype network for the region (Chr 3: 134.66–134.68 Mb, the region between the two arrows in A) with elevated FST. Each circle is a haplotype with size proportional to the number of chromosomes compared to the size of a single chromosome shown on the legend. Haplotypes are connected by lines indicating the pairwise nucleotide distance between them. (C) Hierarchical clustering of the haplotypes in B. Rows show individual haplotypes. The first column indicates population membership for haplotypes, using the same shading code as in B. The remaining columns are SNPs, with gray and black for ancestral and derived alleles, respectively.