Figure 4.

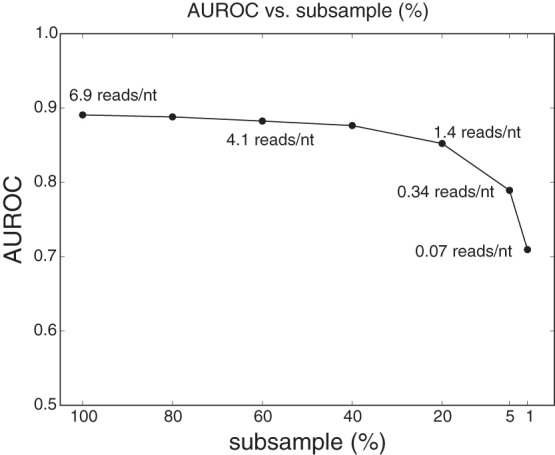
Classification performance (AUROC) as a function of data subsampling percentage. Sequencing depths (measured in reads/nt) corresponding to the subsample percentages are displayed next to the curve.

Classification performance (AUROC) as a function of data subsampling percentage. Sequencing depths (measured in reads/nt) corresponding to the subsample percentages are displayed next to the curve.