Figure 5.
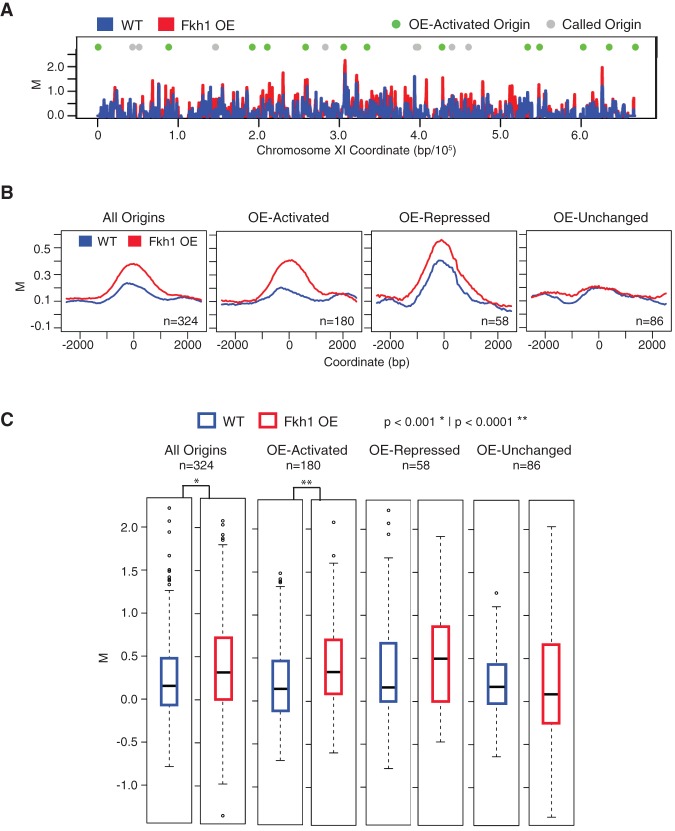
Fkh1-OE increases Fkh1 occupancy at stimulated origins. Strains JPy105 (WT, Fkh1-Myc) and JPy106 (Fkh1-Myc-OE) arrested and induced (but not released into S phase) as described in Figure 2A were subjected to ChIP-chip analysis of Fkh1. (A) ChIP signal along Chromosome XI is plotted with origins indicated above. (B) The average ChIP signal is plotted for 5-kb regions aligned on origins of the indicated groups. (C) Box-and-whisker plots of the distributions of ChIP signals for individual origins within the indicated origin groups.

