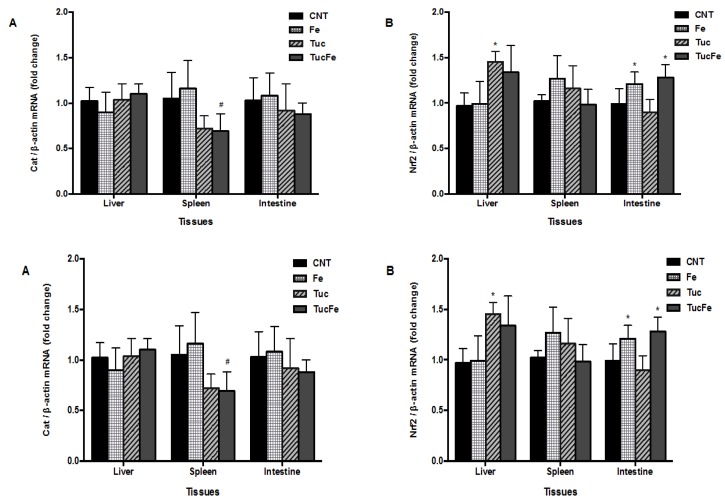
Figure 4.
Quantification of mRNA levels of nuclear factor erythroid 2-related factor 2 (Nrf2) and catalase (Cat) in the liver, spleen and intestine and heme oxygenase-1 (Hmox1) and NAD(P)H dehydrogenase quinone 1 (Nqo1) in the liver, determined by qPCR. CNT, Control group; Fe, iron-enriched group, Tuc, tucum-do-cerrado group; TucFe, tucum-do-cerrado iron-enriched group. Data are the means ± SD (n = 6). Significant differences (p < 0.05): * Comparison to the Control group; # Comparison to the Fe group.

