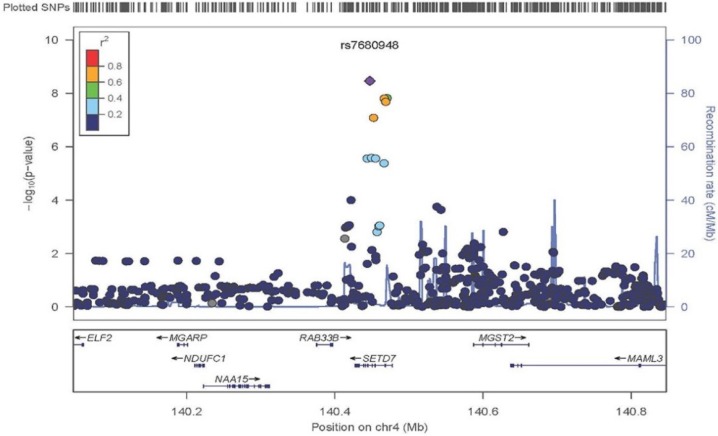
Figure 2.
Regional association plot of chromosome 4q31.1 in the area of SETD7. Variant rs7680948 provides genome-wide significant evidence of association with serum lycopene concentrations. The x-axis represents chromosomal position on chromosome 4 with the location of genes at the locus annotated. The left y-axis shows the p-value for association tests at each locus (dot) on the log scale. The right y-axis provides recombination rates in centimorgans per megabase in the chromosomal region identifying recombination hotspots in the region (grey line). The diamond is the “top hit” (i.e., the strongest association). Other SNPs in the region are represented by circles. The colors indicate linkage disequilibrium per the r2 map on top left. Linkage disequilibrium associated with the top signal appears to span the entire region of gene SETD7.

