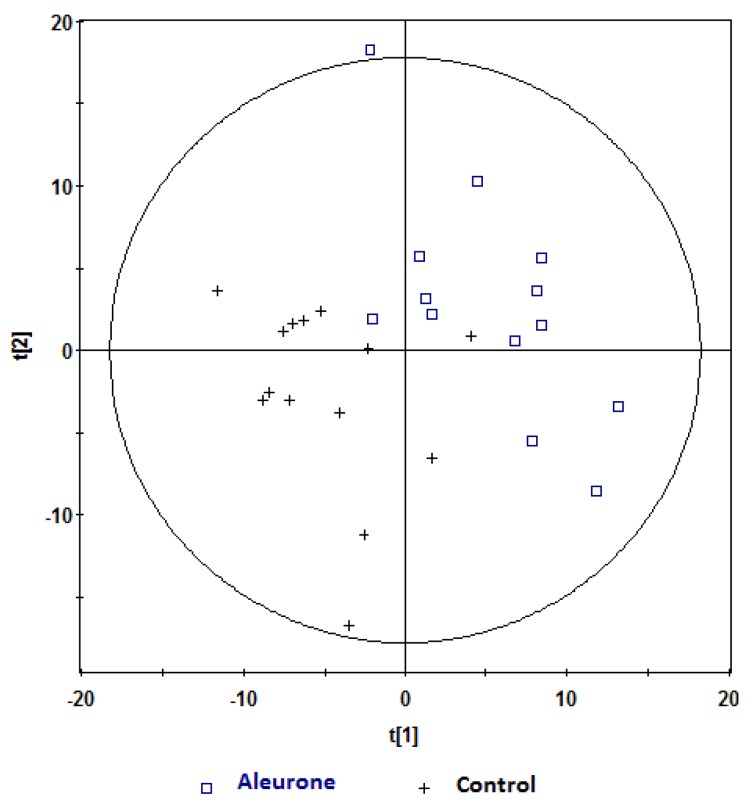
Figure 3.
PLS-DA scores plot (t[1]) vs. t[2]) obtained from 1H NMR spectra of postprandial urine samples of aleurone vs. control at one hour (Observations, n = 27),  , aleurone;
  , control. Variables (K) = 181. PLS component 1: R2 = 0.196, Q2 = 0.315; PLS component 2: R2 = 0.18, Q2 = 0.117. The ellipse represents 95% confidence region of the model based on Hotelling T2.

