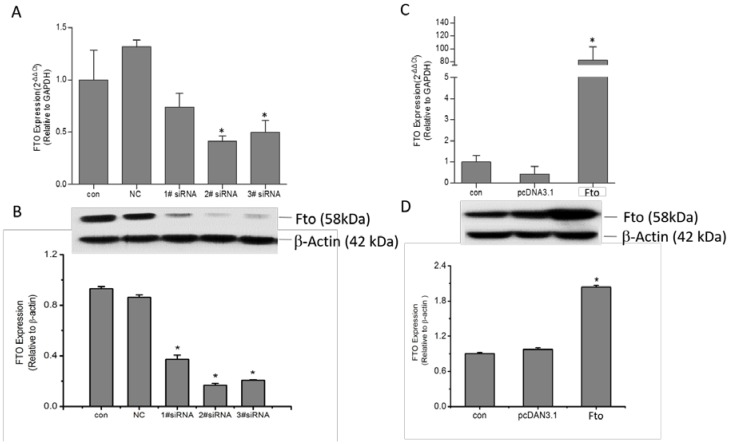
Figure 1.
Construction of Fto knockdown or overexpressed pre-adipocyte model: (A) 3T3-L1 cells were transfected with siRNA control or three Fto specific siRNAs for 24 h. Fto mRNA was identified using qRT-PCR, with GAPDH as control gene. The value of 2−∆∆CT was represented as Means ± SD of three independent analyses. * p < 0.05, versus NC group. (B) Western blot was applied to determine the Fto protein expression. The expression level was quantified as fold changes in grey value, with β-actin as the loading control. * p < 0.05, versus NC group. (C) The Fto mRNA expression and (D) protein expression level in 3T3-L1 cells were separately detected 24 h after transient transfection of pcDNA3.1-Fto or empty pcDNA3.1 vector, as described above. * p < 0.05 versus empty pcDNA3.1 vector group.

