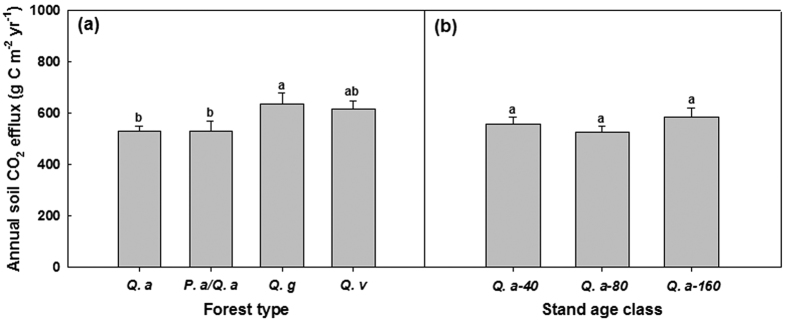
Figure 2. Soil CO2 efflux in plots of contrasting forest types and stand age classes.
Error bars represent 1 SE (n = 3). Different letters above the error bars indicate significant differences among forest types/stand age classes (P < 0.05). Q.a: Q. aliena forest; P.a/Q.a: mixed P. armandii/Q. aliena forest; Q.g: Q. glandulifera forest; Q.v: Q. variabilis forest; Q.a-40: 40-year Q. aliena forest; Q.a-80: 80-year Q. aliena forest; Q.a-160: >160-year Q. aliena forest.

