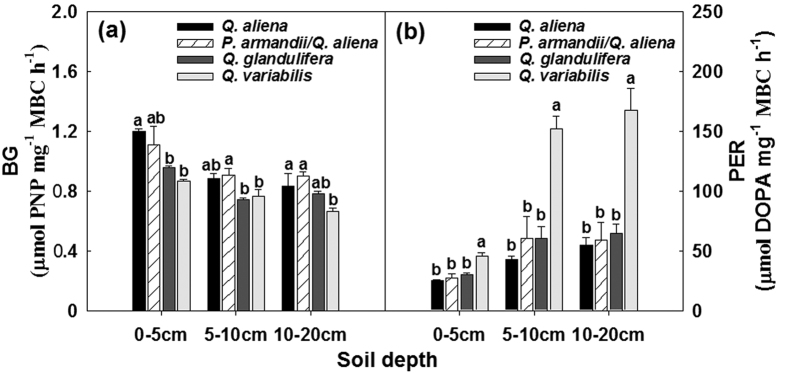
Figure 8. Mean values of specific activities of β-1,4-glucosidase (BG) and peroxidase (PER) in the 0–5, 5–10, 10–20 cm soil layers in plots of contrasting forest types during the growing seasons from 2011 to 2012.
Error bars represent 1 SE (n = 3). Different letters above the error bars indicate significant differences among forest types within given soil layers (P < 0.05).

