Figure 8.
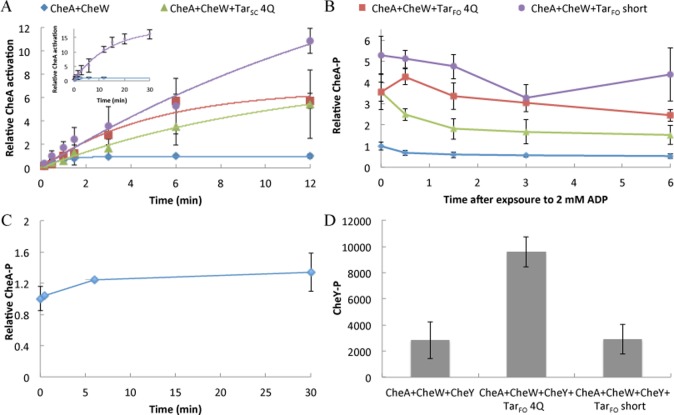
Kinetics of CheA autophosphorylation with Tar variants. E. coli CheA, CheW, and TarFO 4Q and short or TarSC (in a 1:1:3 subunit ratio, 1 μM CheA note that the receptor subunit is a single-chain “dimer”) were allowed to complex at 25 °C for 1 h prior to exposure to [γ-32P]ATP for the indicated time points. Each data point represents an average over two to four assays. (A) CheA-P formation over time in the presence of CheW and Tar variants. The inset shows CheA-P buildup with TarFO short compared to CheA:CheW alone out to 30 min. Curves were fit to a first-order kinetic transition (see Experimental Procedures). (B) Addition of cold ADP to CheA and CheW with or without Tar variants after initial autophosphorylation with [γ-32P]ATP for 6 min. (C) Addition of cold ATP to CheA and CheW after incubation with [γ-32P]ATP for 6 min. (D) Transfer to CheY in the presence of CheA and CheW with or without TarFO 4Q and short. Error bars represent the standard error of the mean (SEM) calculated from three independent experiments (n = 3).

