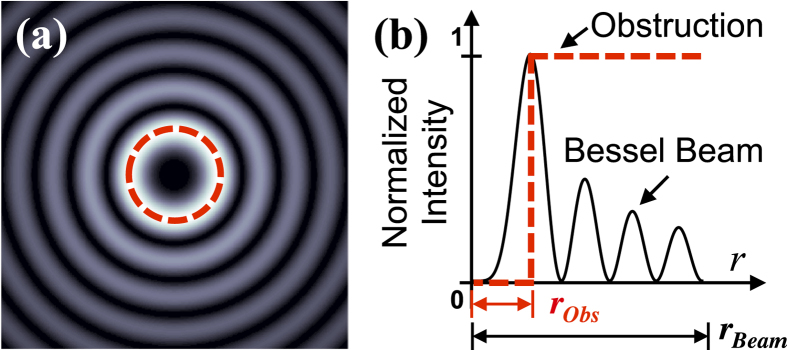
Figure 4. Pictorial depiction of an obstructed BG beam.
(a) Transverse intensity profile of a BG beam. Dashed circle signifies opaque circular obstruction placed at the beam centre. In experiment, the obstruction is laterally moved to block the beam at various transverse positions. (b) Cross-section of BG beam intensity. Dashed line represents the cross-section of the opaque obstruction. Here  is the radius of the obstruction, and
  is the spot size of the beam as determined by measurements and subsequently calculating the second moment of the intensity.

