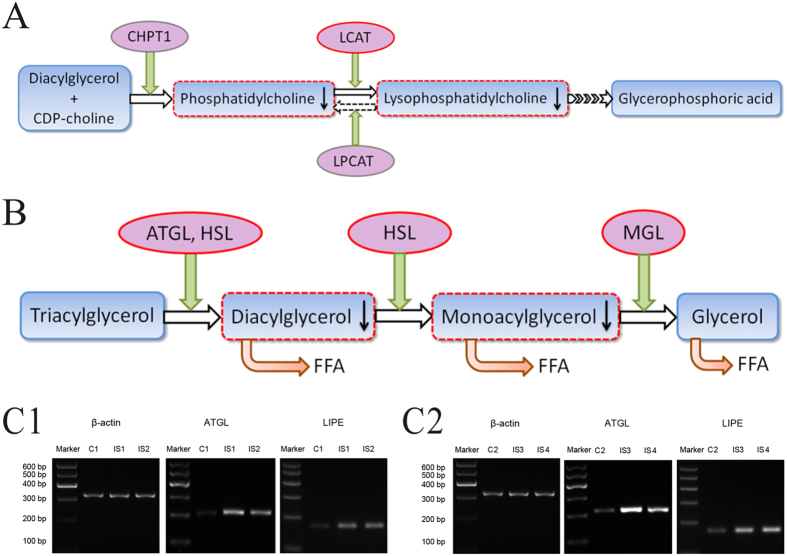
Figure 5. Metabolic pathway related to potential biomarkers indicated by UPLC-MS analysis and RT-PCR results of ATGL and HSL.
(A) metabolic pathway of LysoPC; (B) catabolism pathway of triacylglycerol; C1-C2, RT-PCR results of ATGL and HSL in adipose tissues (LIPE is the gene aliase of HSL; C1-2, adipose tissues from the two control patients; IS1-4, adipose tissues from the four AIS patients). CHPT1, choline phosphotransferase 1; LCAT, lecithin: cholesterol acyltransferase; LPCAT, lysophosphatidylcholine acyltransferase; ATGL, adipose triglyceride lipase; HSL, hormone sensitive lipase; MGL, monoacylglycerol lipase; FFA, free fatty acid.

