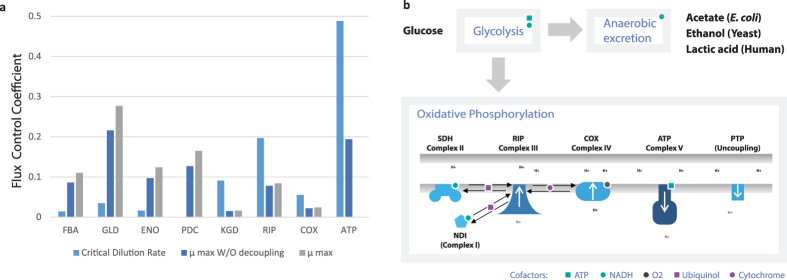
Figure 3.
(a) Flux control coefficients (FCC) quantify the relation between enzyme activity and the predicted growth. The critical growth rate is dominated by enzymes from oxidative phosphorylation, and the maximum growth rate by enzymes from glycolysis. Figure shows enzymes for which  , a full list is also available (Supplementary Table S3). (b) A branch point between oxidative phosphorylation and anaerobic excretion is present in several organisms, with organism specific fermentation products. The rate of ATP formation by F1F0-ATP synthase (complex V) is given by the proton motive force. This force can be uncoupled using the permeability transition pore (PTP) which allows Complex I–IV to use oxygen as an electron acceptor unconstrained by the low activity of Complex V.

