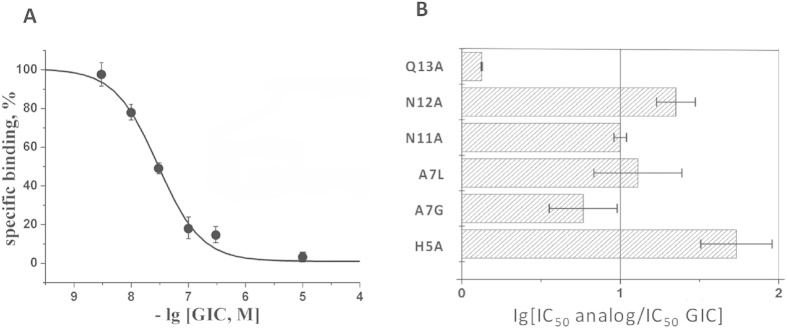
Figure 4. The binding affinity of α-conotoxin GIC and its mutants to Ac-AChBP measured by a competitive radioligand assay.
(A) The inhibition curve for α-conotoxin GIC wild-type is shown. Each point is a mean ± s.e.m value of two measurements for each concentration of one experiment. The curve was calculated from the means ± s.e.m. using the ORIGIN 7.5 program. The calculated IC50 value is 29 ± 2 nM. (B) The bar diagram showing the differences in IC50 values for GIC mutants in comparison with wild-type peptides.

