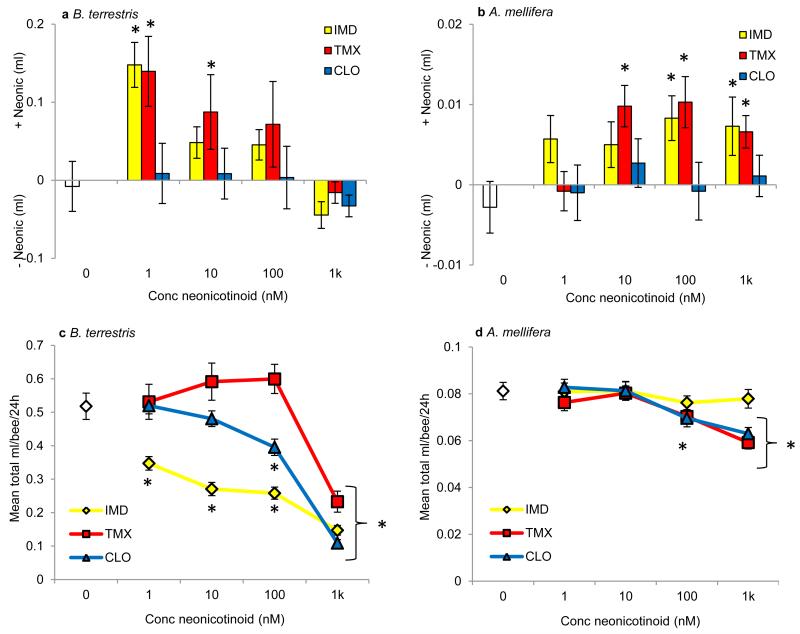
Figure 1. Foraging-age bees prefer to eat food containing neonicotinoids.
a, Bumblebees and (b) honeybees given a choice of sucrose or sucrose containing a neonicotinoid pesticide chose to eat solutions containing IMD and TMX (Extended Data Table 2, bumblebees: GLM: χ22 = 12.1, P = 0.002; honeybees: χ22 = 11.1, P = 0.004). Data represent the difference in the amount consumed over 24 h; positive values indicate a preference for solutions containing neonicotinoids. White bars indicate the sucrose control. Asterisks indicate P ≤ 0.002 (Bonferroni-adjusted critical value) for one-sample t-tests against the ‘0’ value (indicating no preference, see Extended Data Table 3). Bumblebees: IMD: 1nM = 57, 10nM = 66, 100nM = 65, 1μM = 66; TMX: 1nM = 38, 10nM = 39, 100nM = 36, 1μM = 40; CLO: 1nM = 57, 10nM = 59, 100nM = 48, 1μM = 62; honeybees: N = 40 cohorts of 25 bees/treatment. (c) The total amount of food eaten from both tubes by bumblebees was affected by the concentration and the presence of a neonicotinoid pesticide (GLM: χ62 = 47.7, P < 0.001, Extended Data Table 2) in one of the food tubes. (d) Honeybees ate less total food only when it contained 1k nM TMX or CLO (GLM: χ62 = 10.5, P = 0.005, Extended Data Table 2). White diamonds indicate amount eaten by sucrose control group. * indicates P < 0.05 in post hoc comparisons against sucrose. Error bars represent ± SE.

