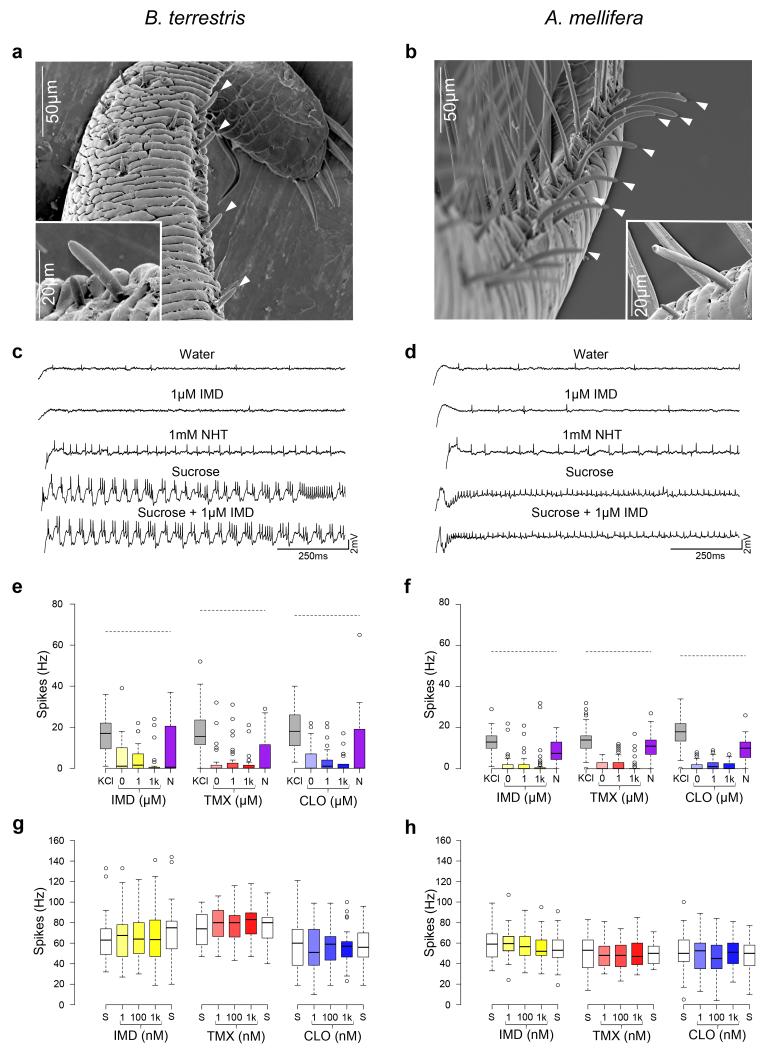
Figure 2. Electrophysiological recordings of the gustatory receptor neurons from the mouthparts of bumblebees and honeybees during stimulation with neonicotinoids.
a, Scanning electron micrographs (SEM) of the galea (white arrows) of bumblebees and (b) honeybees. Recordings were made from the basiconic sensilla of the galea (white arrows); inserts are higher resolution SEM of individual sensilla. c, d. Spike trains recorded from both species reveal responses to NHT and to sucrose, but not to IMD. Boxplots of the spiking responses of gustatory neurons of the mouthparts of bumblebees (e) and honeybees (f) to KCl, NHT and two concentrations of each of the neonicotinoids. Dashed lines represent the median response to 50 mM sucrose. Solutions of the three neonicotinoids did not elicit activity from gustatory neurons greater than the response to water (indicated as ‘0’ on x-axis) (Extended Data Table 5, ANOVA: bumblebees: F2,77 = 0.935, P = 0.397; honeybees: F2,144 = 2.38, P = 0.096). (Note: NHT elicited spike frequencies in gustatory neurons greater than those elicited by water in only 7/17 of the bumblebees we tested, whereas NHT elicited spike frequencies greater than water in all of the honeybees tested). Bumblebees: NIMD = 5; NTMX = 7; NCLO = 5. Honeybees: NIMD = 5; NTMX = 5; NCLO = 6. g, h. The spiking response to sucrose was not reduced by the presence of the neonicotinoids at concentrations in the nectar-relevant range (Extended Data Table 5, ANOVA: bumblebees: F1,86 = 0.579, P = 0.449; honeybees: F1,127 = 2.00, P = 0.053). Bumblebees: NIMD = 8; NTMX = 5; NCLO = 6. Honeybees: NIMD = 6; NTMX = 5; NCLO = 6. Boxplots represent the median (black bars), the 1.5 interquartile range (whiskers) and outliers (circles). Stimuli on x-axes of e-h are in order of presentation during the experiment.

