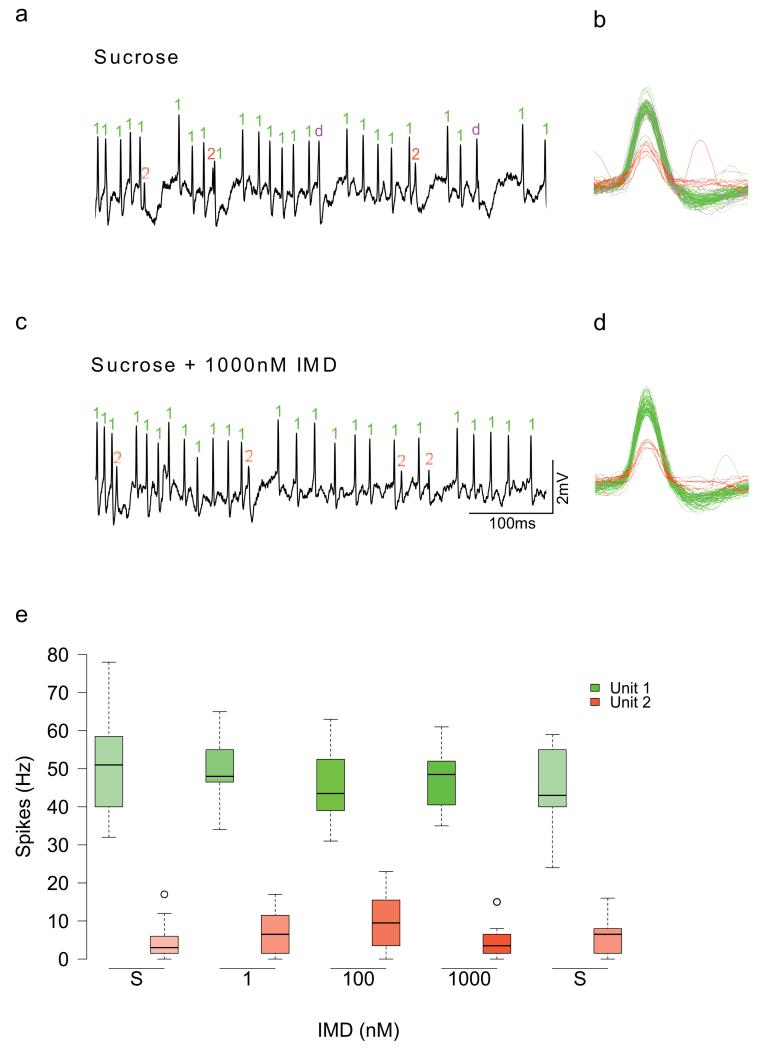
Extended Data Figure 4: Spike-sorted recordings for four of the honeybees in Figure 2.
a, To verify that the spike rates we observed in Figure 2 were not a result in changes in the rates of firing of individual neurons, we spike sorted recordings from 4 honeybees. b, Spike sorting revealed 2 potential spiking neurons (units) with different amplitudes that responded by eliciting spikes during sucrose stimulation. (This was also observed previously by Wright et al. 201017). One neuron is labelled in green, the other in red. Spike doublets (indicated in pink as ‘d’) where both neurons spiked nearly simultaneously were also observed. c, d. These same two spiking neurons continued to respond when stimulated with sucrose containing 1uM IMD. e, Boxplots reveal that the rate of spiking was lower on average for one of the neurons (repeated-measures ANOVA, unit: F1,36 = 596, P < 0.001). The rate of firing of both neurons was not affected by IMD concentration (repeated-measures ANOVA, unit: F1,36 = 0.369, P = 0.547). Spikes from additional neurons (units) were not detected, and so we concluded that no other neurons were recruited during stimulation with IMD. ‘S’ indicates stimulation with sucrose. Boxplots represent the median (black bars), the 1.5 interquartile range (whiskers) and outliers (circles). Stimuli on x-axis are in order of presentation during the experiment.

