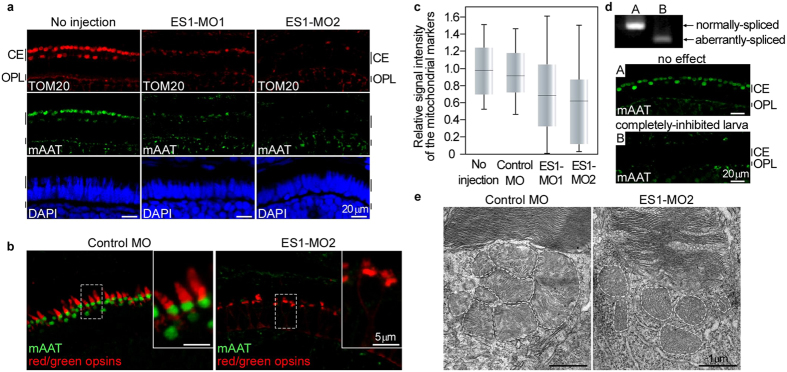
Figure 2. Knocking-down of ES1 resulted in formation of smaller mitochondria in cones.
(a) Immunohistochemistry of retinal sections from ES1-MOs-injected or non-injected larvae at 4 dpf stage with both TOM20 (red) and mAAT (green) antibodies. Nuclei were stained with DAPI (blue). CE: cone ellipsoid, OPL: outer plexiform layer. (b) Immunohistochemistry with red/green opsins (cone outer segment marker, red) and mAAT (green) antibodies. The inset in each panel is a magnified view of the area surrounded by the dashed line. (c) Quantification of relative signal intensities of the mitochondrial markers from the cone ellipsoid layer of each MO-injected class; no injection (n = 28), control MO (n = 23), ES1-MO1 (n = 37) and ES1-MO2 (n = 23). Data are presented as box-whisker plots showing the median, quartiles and range. Mean value of no injection class was set to 1.0. (d) A paired RT-PCR (top) and immunohistochemical analysis (middle and bottom) in a single larva using a single eye for each analysis without (A) or with (B) the knock down effect of ES1-MO1. A completely-inhibited larva showed the relative immunopositive signal intensity of 0.20 (B), whereas a larva representing no inhibition showed 0.77 (A). (e) Representatives of electron microscopic images of cone mitochondria of control MO-injected (left panel) or ES1-MO2-injected (right panel) larvae at 4 dpf. Dashed lines outline each mitochondrion. The images without the outlines are shown in Supplementary Fig. S5.

