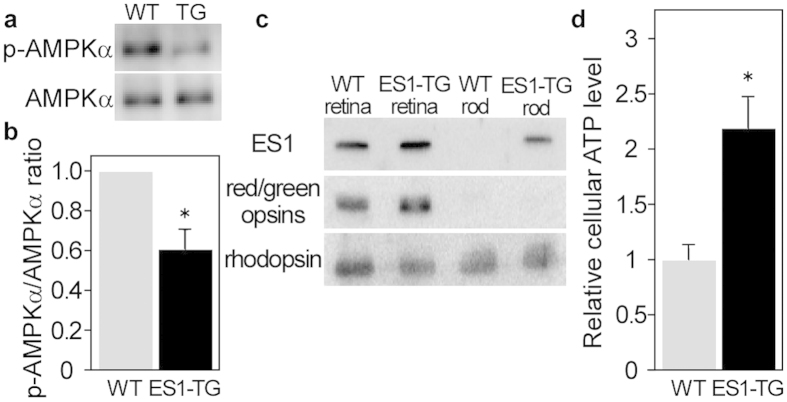
Figure 5. ES1-enhanced mitochondrial energy production in rods.
(a) A representative result of immunoblottings with antibodies against AMPKα and phospho-AMPKα for estimation of phosphorylation levels of AMPKα in rods isolated from ES1-TG or WT siblings. (b) Relative phosphorylation levels of AMPKα in isolated rods assessed by the immunoblottings. Values are means ± S.E., *P = 0.008 in Student’s t-test, n = 7 for both WT and ES1-TG. (c) Immunoblottings of both the retinas and rods isolated from ES1-TG or WT siblings with antibodies against ES1, red/green opsins or rhodopsin. (d) Relative ATP levels in an isolated rod. Values are means ± S.E., *P = 0.002 in Student’s t-test, n = 8 for both ES1-TG and WT.

