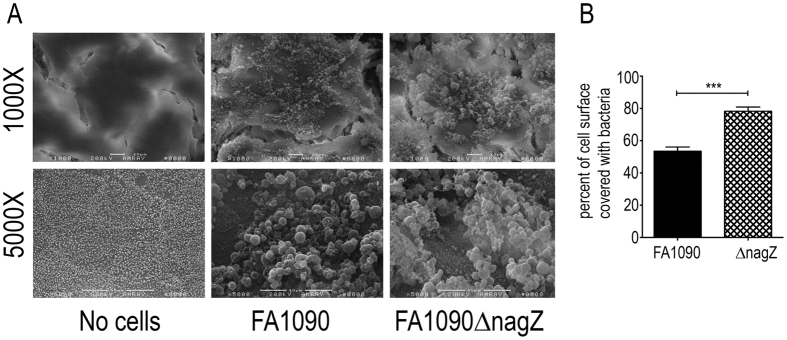
Figure 5. Gonococcal biofilm formation of polarized T84 cells.
The left side of the figure are representative SEMs of T84 cells at different magnifications, colonized with or without added gonococci. The no cells control is untreated T84 epithelial cells showing normal morphology of these cells as visualized by SEM. The graph on the right is a quantification of the biofilms. The percent of the surface covered by biofilm was measured using ImageJ analysis. Multiple images (n = 9) were evaluated using SEM and the significance of the differences determined with Student’s t-test. (***p < 0.001).

